Load Matching
Role:
Product Designer
Industry:
Freight Forwarding and Logistics
Duration:
3 Months
Role:
Product Designer
Industry:
Freight Forwarding and Logistics
Duration:
3 Months

I was brought in as a product designer for the redesign of a saas product for freight dispatchers. Tasked with merging driver routing features with a load matching tool, I was able to deliver the client's expectations.
The last mile freight delivery industry is complex; along with the normal process of delivering to a recipient, this field has extra considerations such as when cargo can be picked up, how long a carrier has to deliver it, and additional fees that add up to costs when an empty container arrives late to port. Behind the scenes there is a lot of coordination that needs to happen between drivers, dispatchers, customers and carriers.
Over the last couple of months a logistics software startup has been diligently working on simplifying this process and creating value for firms that have become accustomed to the traditional way of tackling this industry.
Cross.Team was brought in to improve the experience, visual design and performance of the product as well as prepare it for launch to market. The first task was to merge important routing information when load matching, when these were on two separate screens.
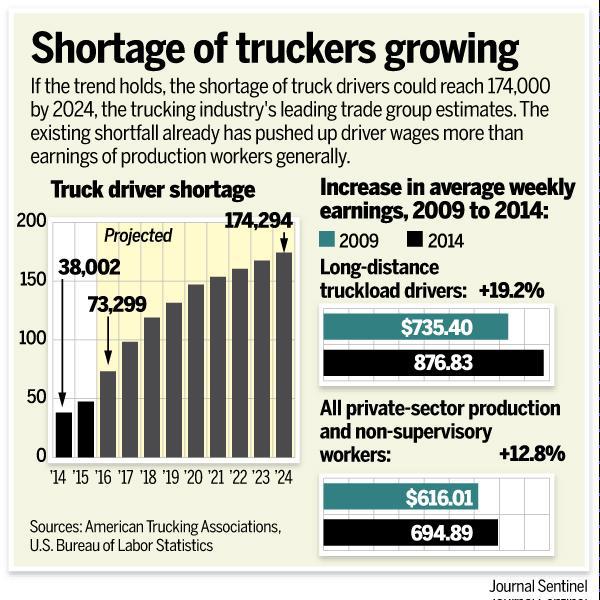
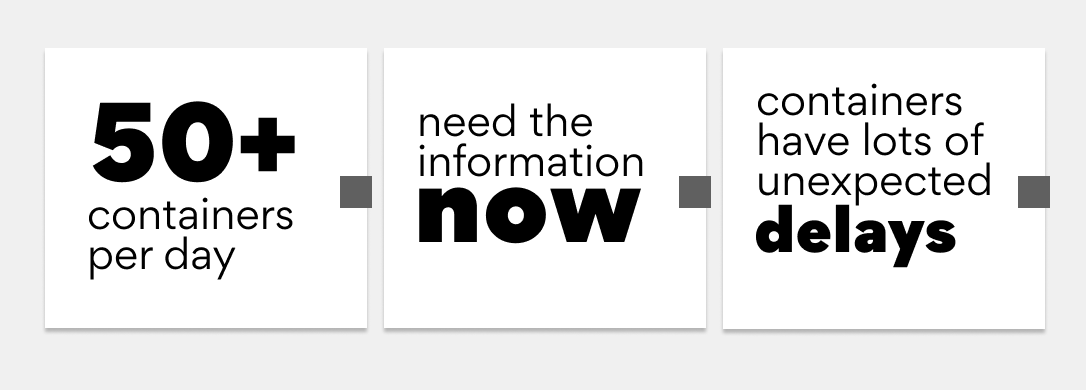
The first step I took towards understanding the context in which the product exists was to research the industry. Some notable insights I found helpful where:
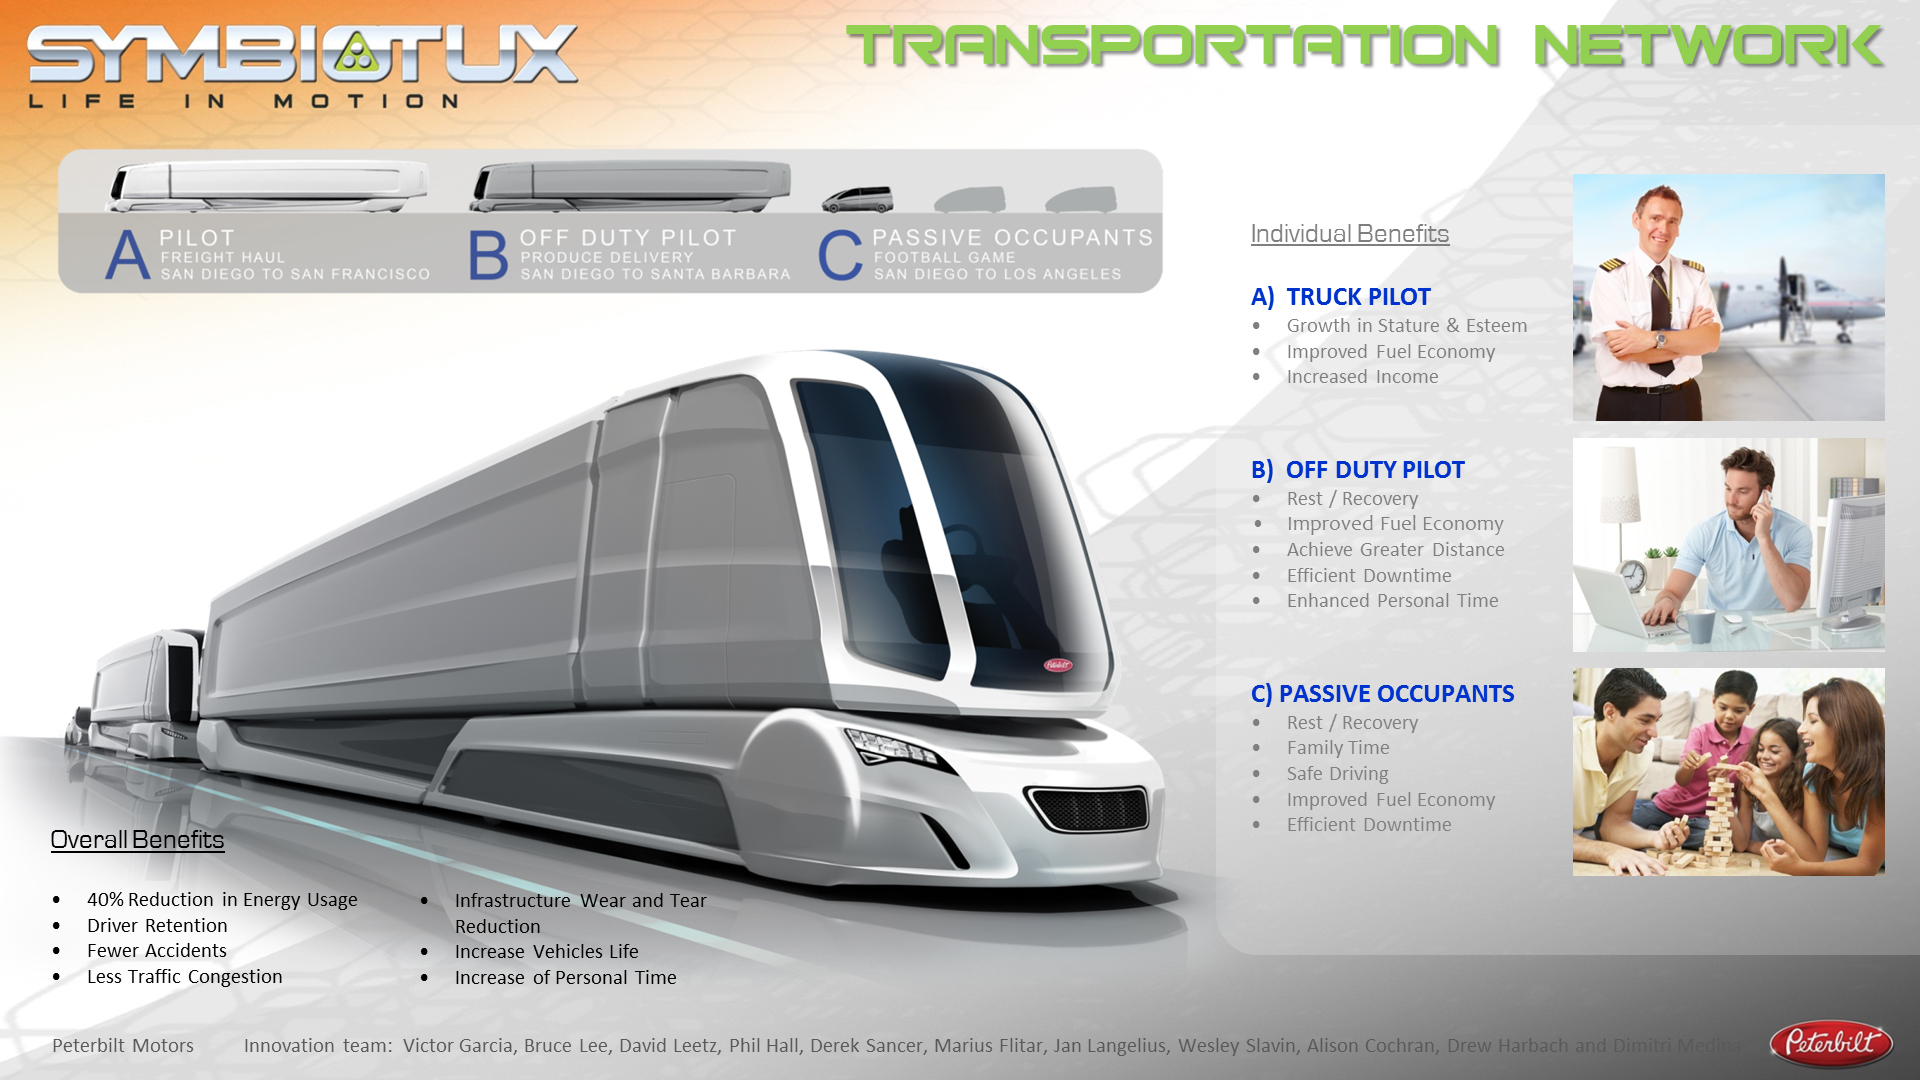
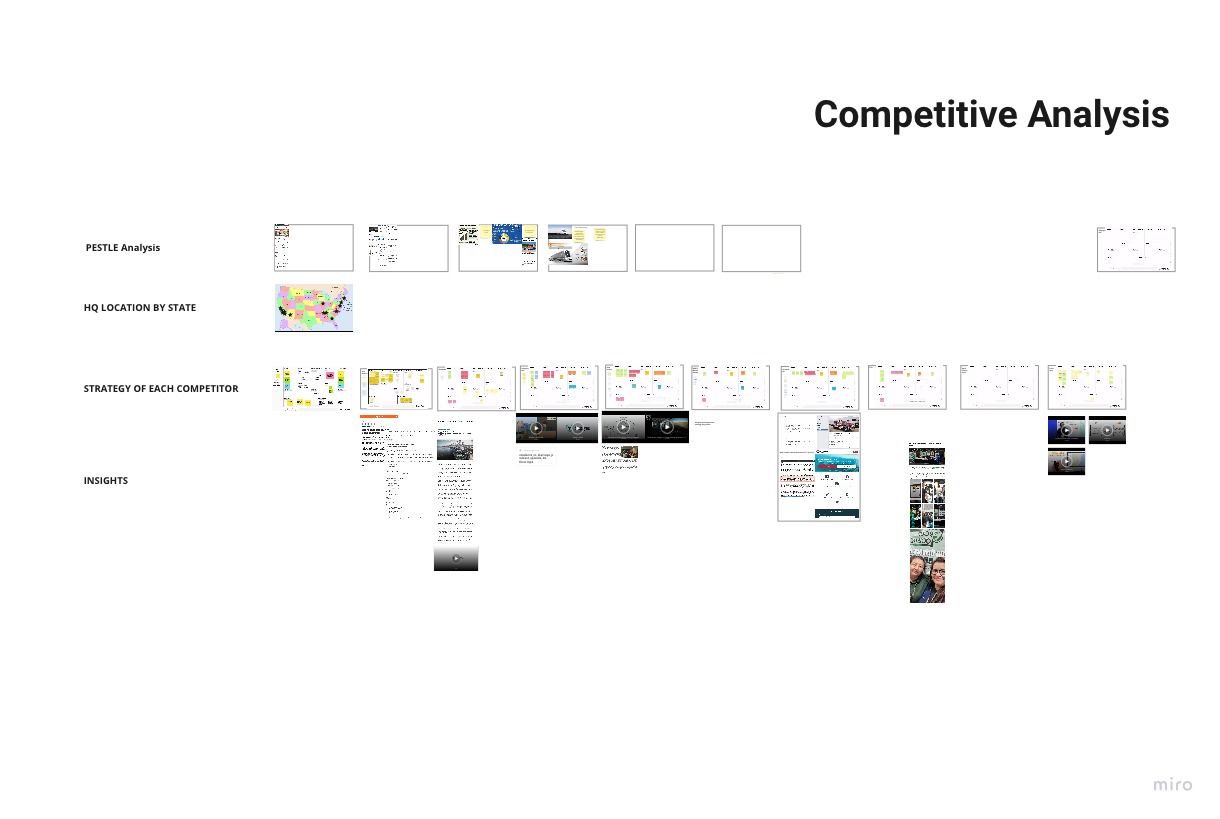
I then researched similar products and competitors to look at the market factors and directions that other firms are trying out; to make sure the product strategy would be able to find a profitable space in the marketplace.
There was a lot of industry specific terminology and processes that I had to learn before beginning product onboarding. Below is a one way look at the simplest of representation of the process.
Once we look at use cases involving return trips, refrigerated containers, hazardous material and overweight cargo; it really helped that I had previous experience in the industry.
After product onboarding, my first task was to conduct a preliminary heuristics analysis and make it viewable to the entire team.
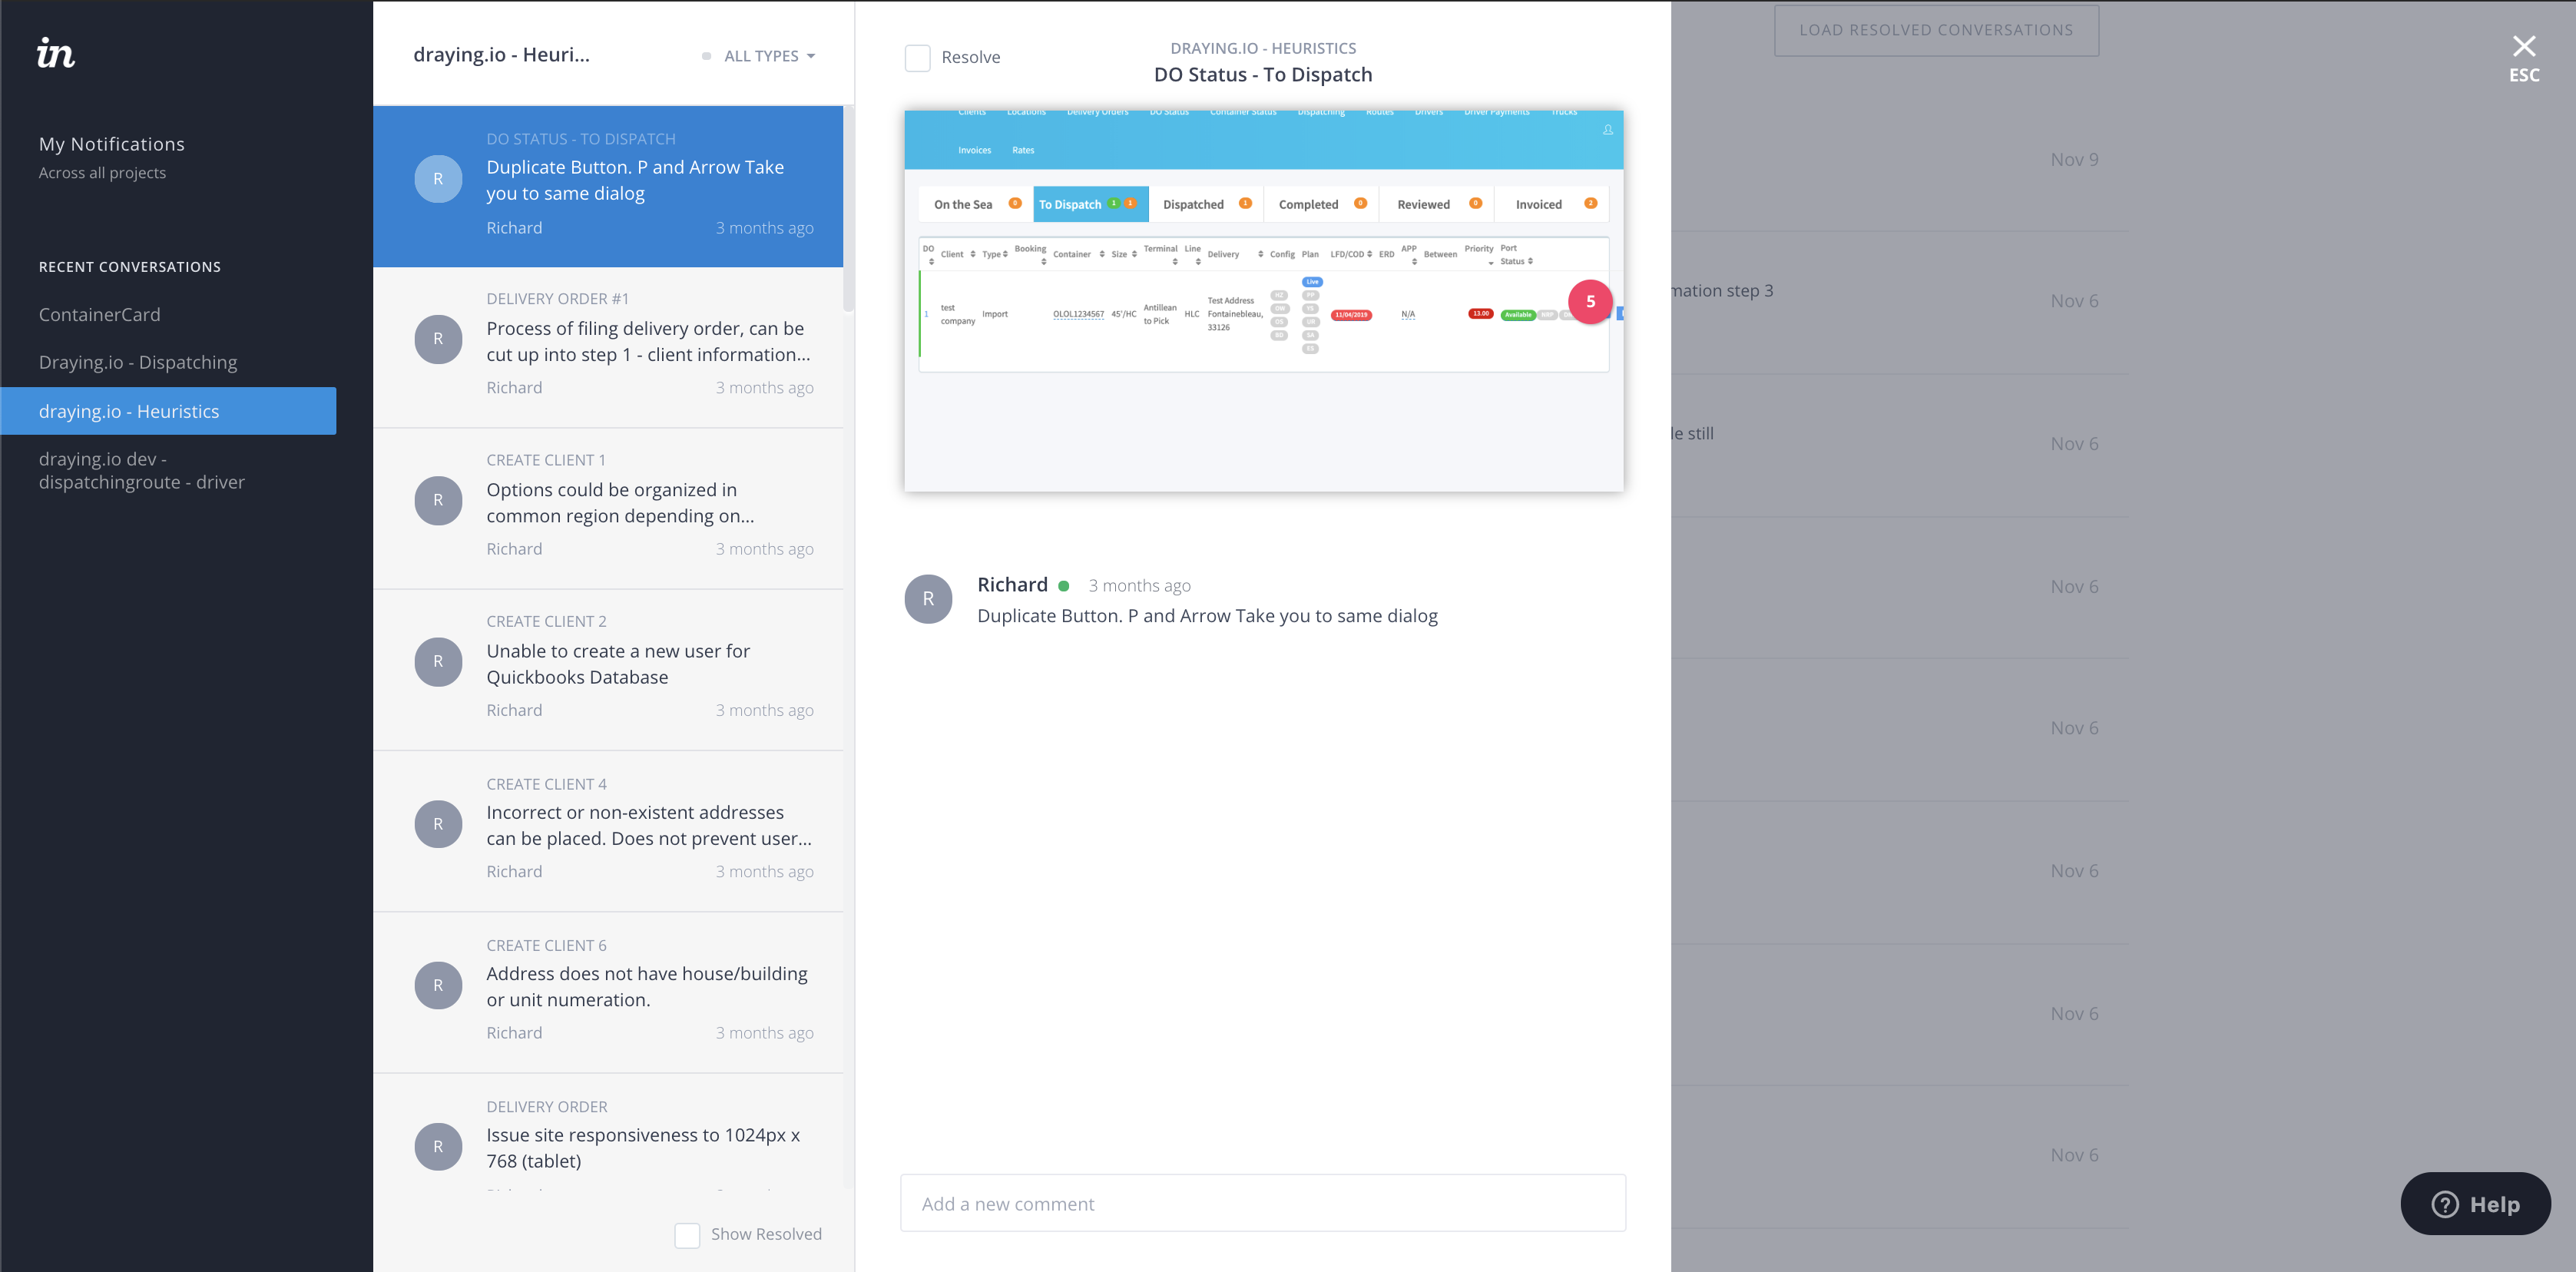
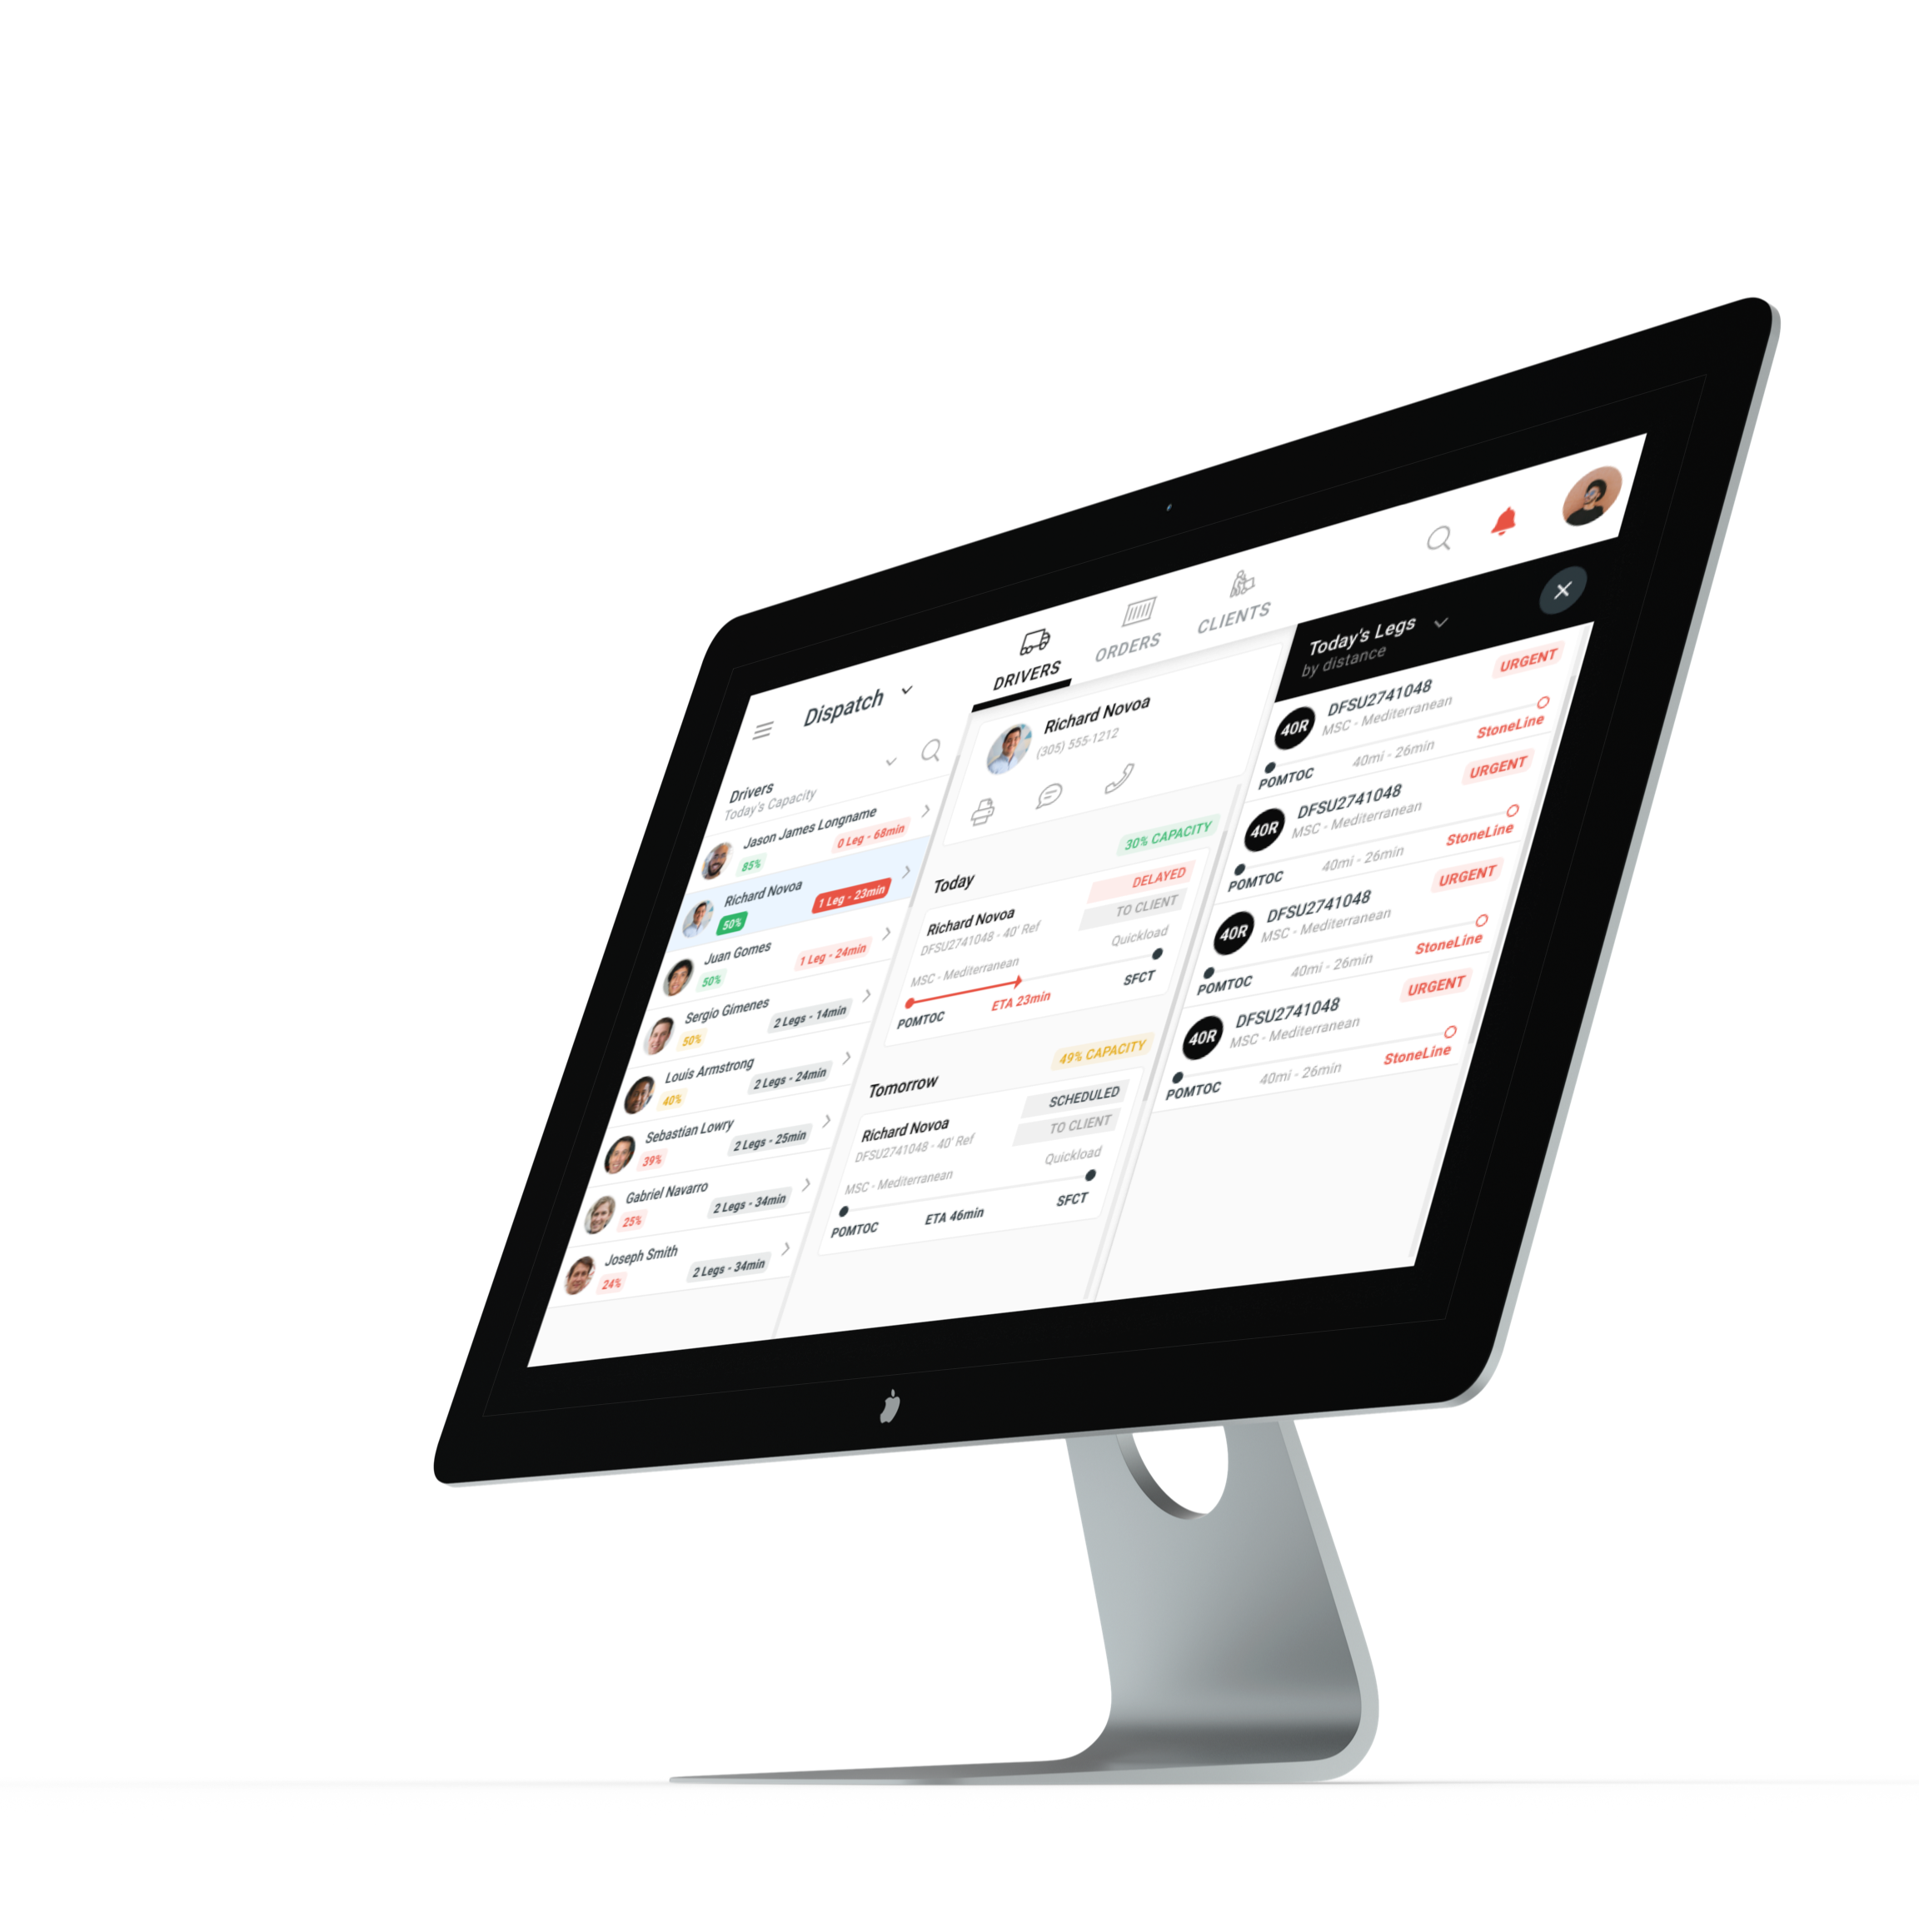
The main screen users spent their time on was the following Kanban view, where each card represents a container, and each column represented the stage of delivery of that container.
.png)
There was a lot of scrolling required to browse the container cards, and a lot of bright alerts and indicators that reminded me of Don Norman's recounting of the 3-Mile island incident.
The next screen was a way to look at the containers from a routing and driver scheduling point of view.
.png)

The brief was clear, merge both screens into an efficient, practical and visually stunning user experience.


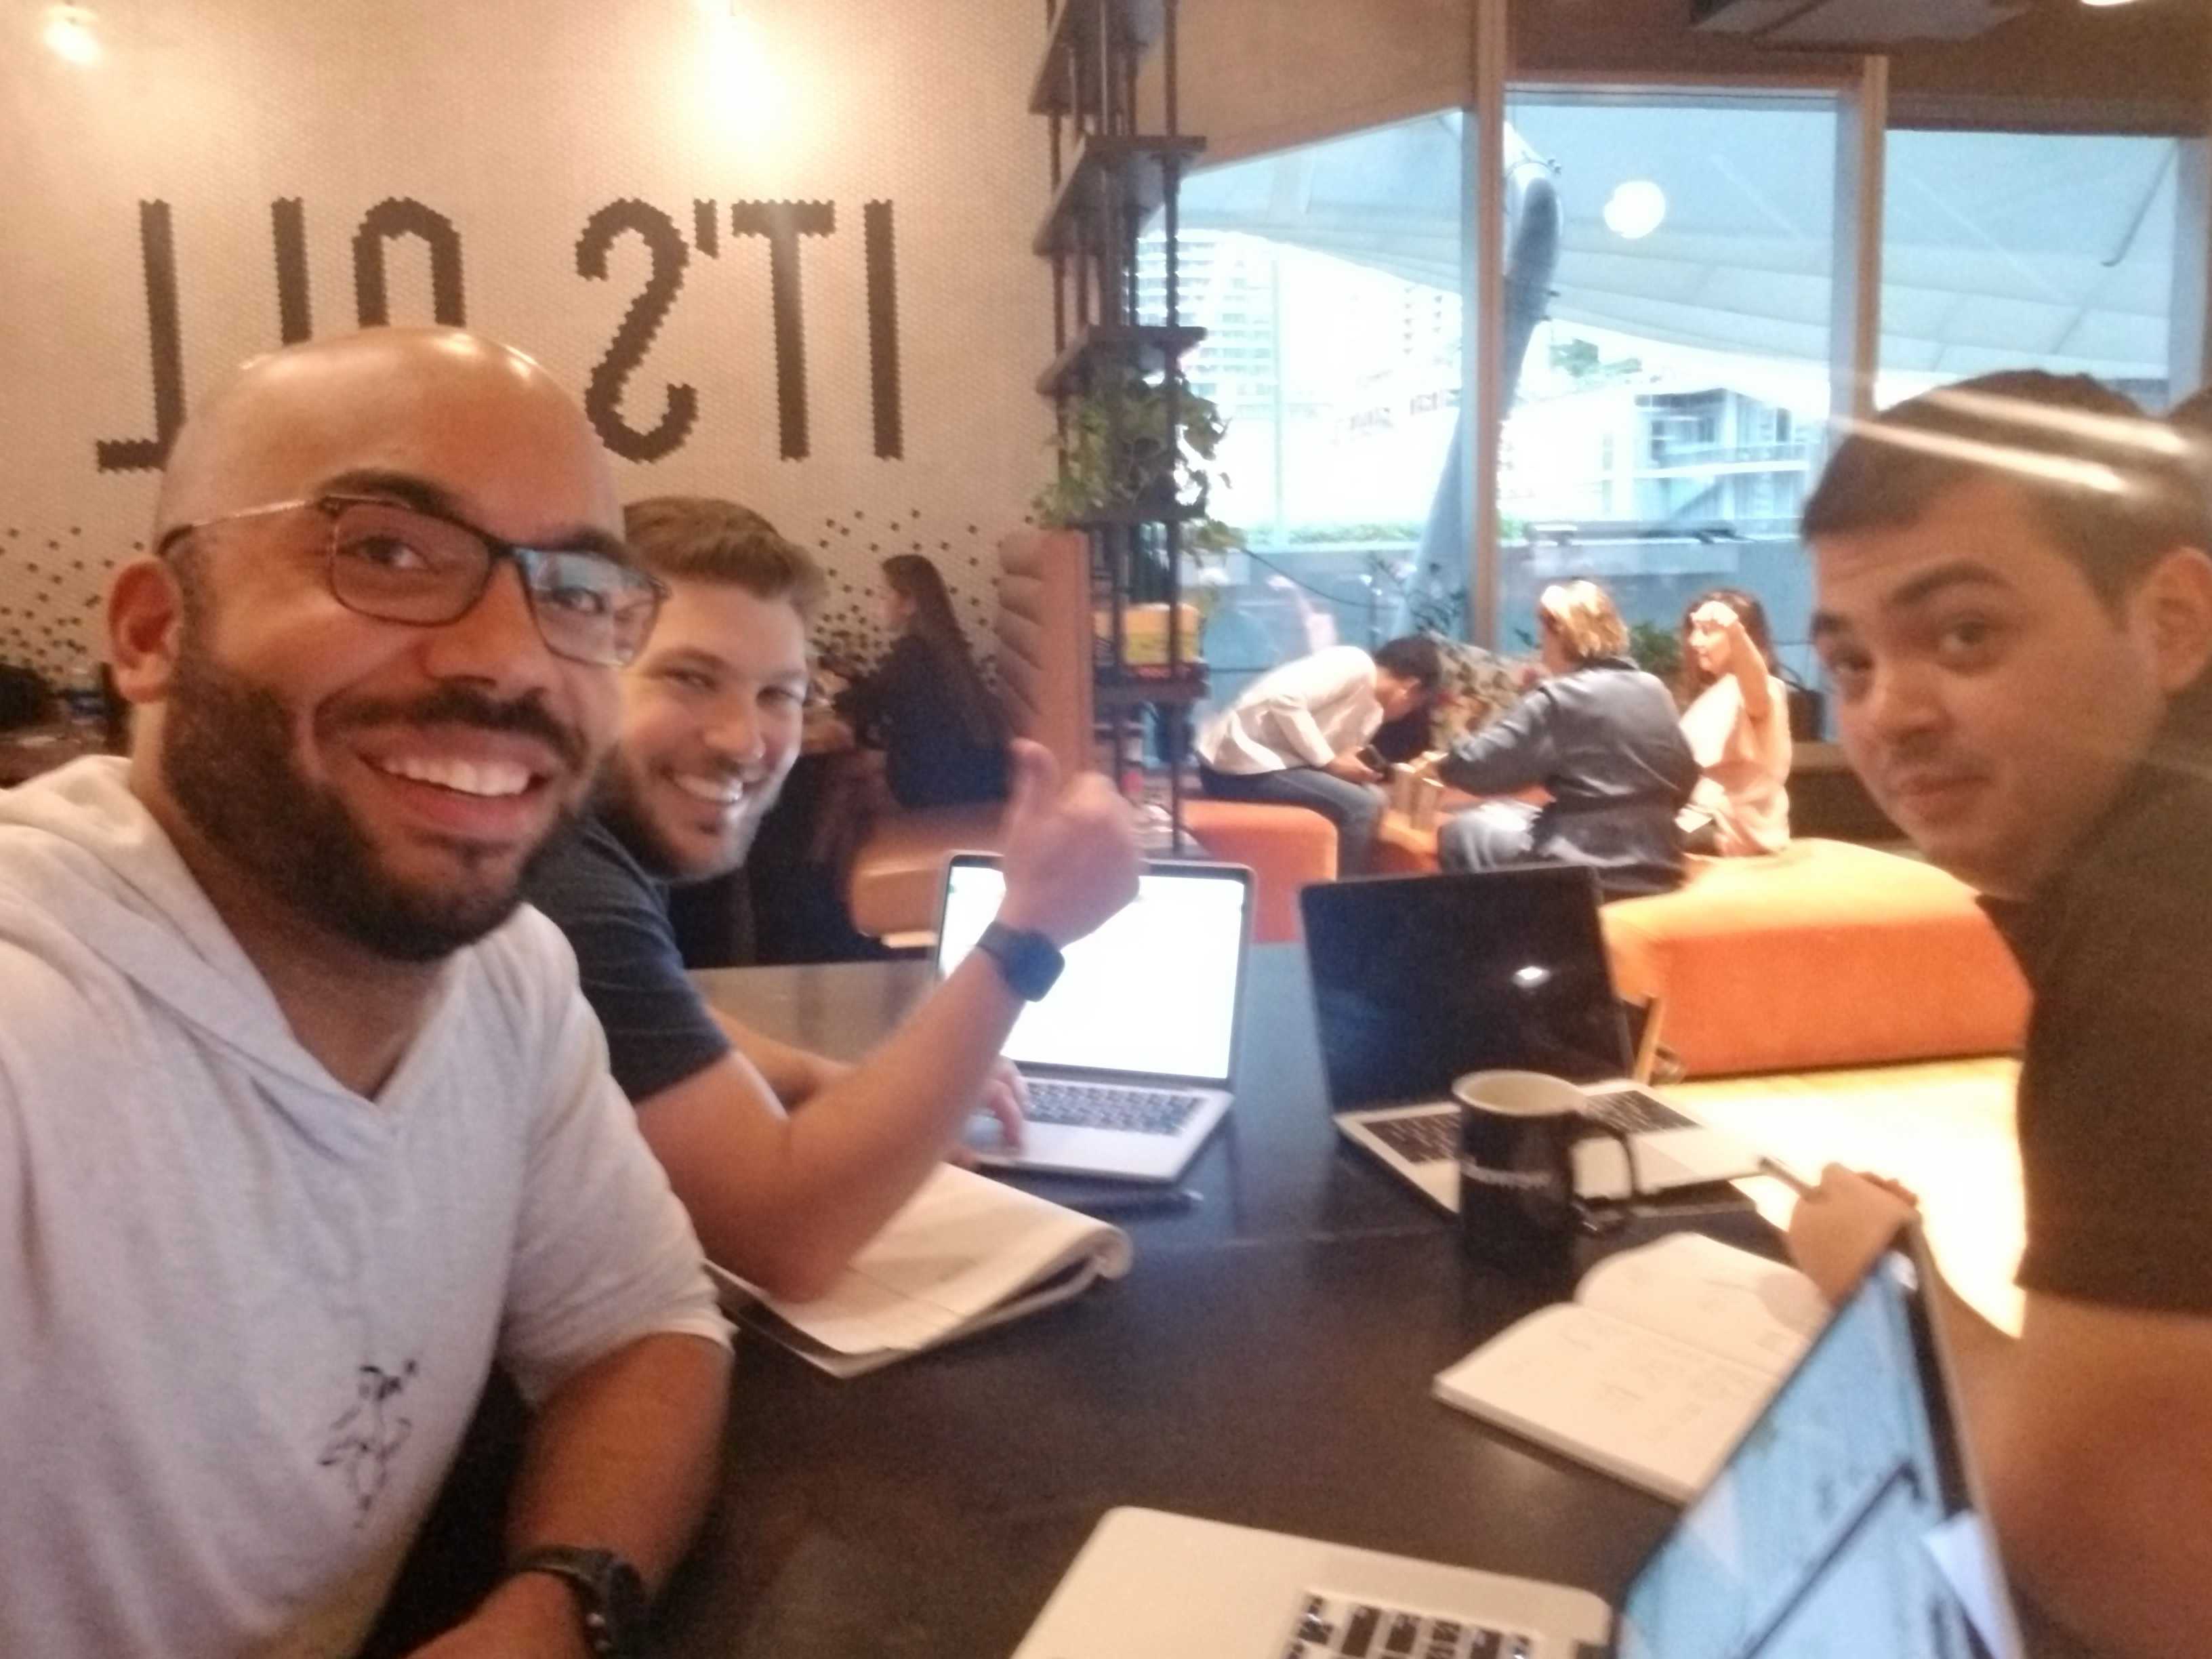
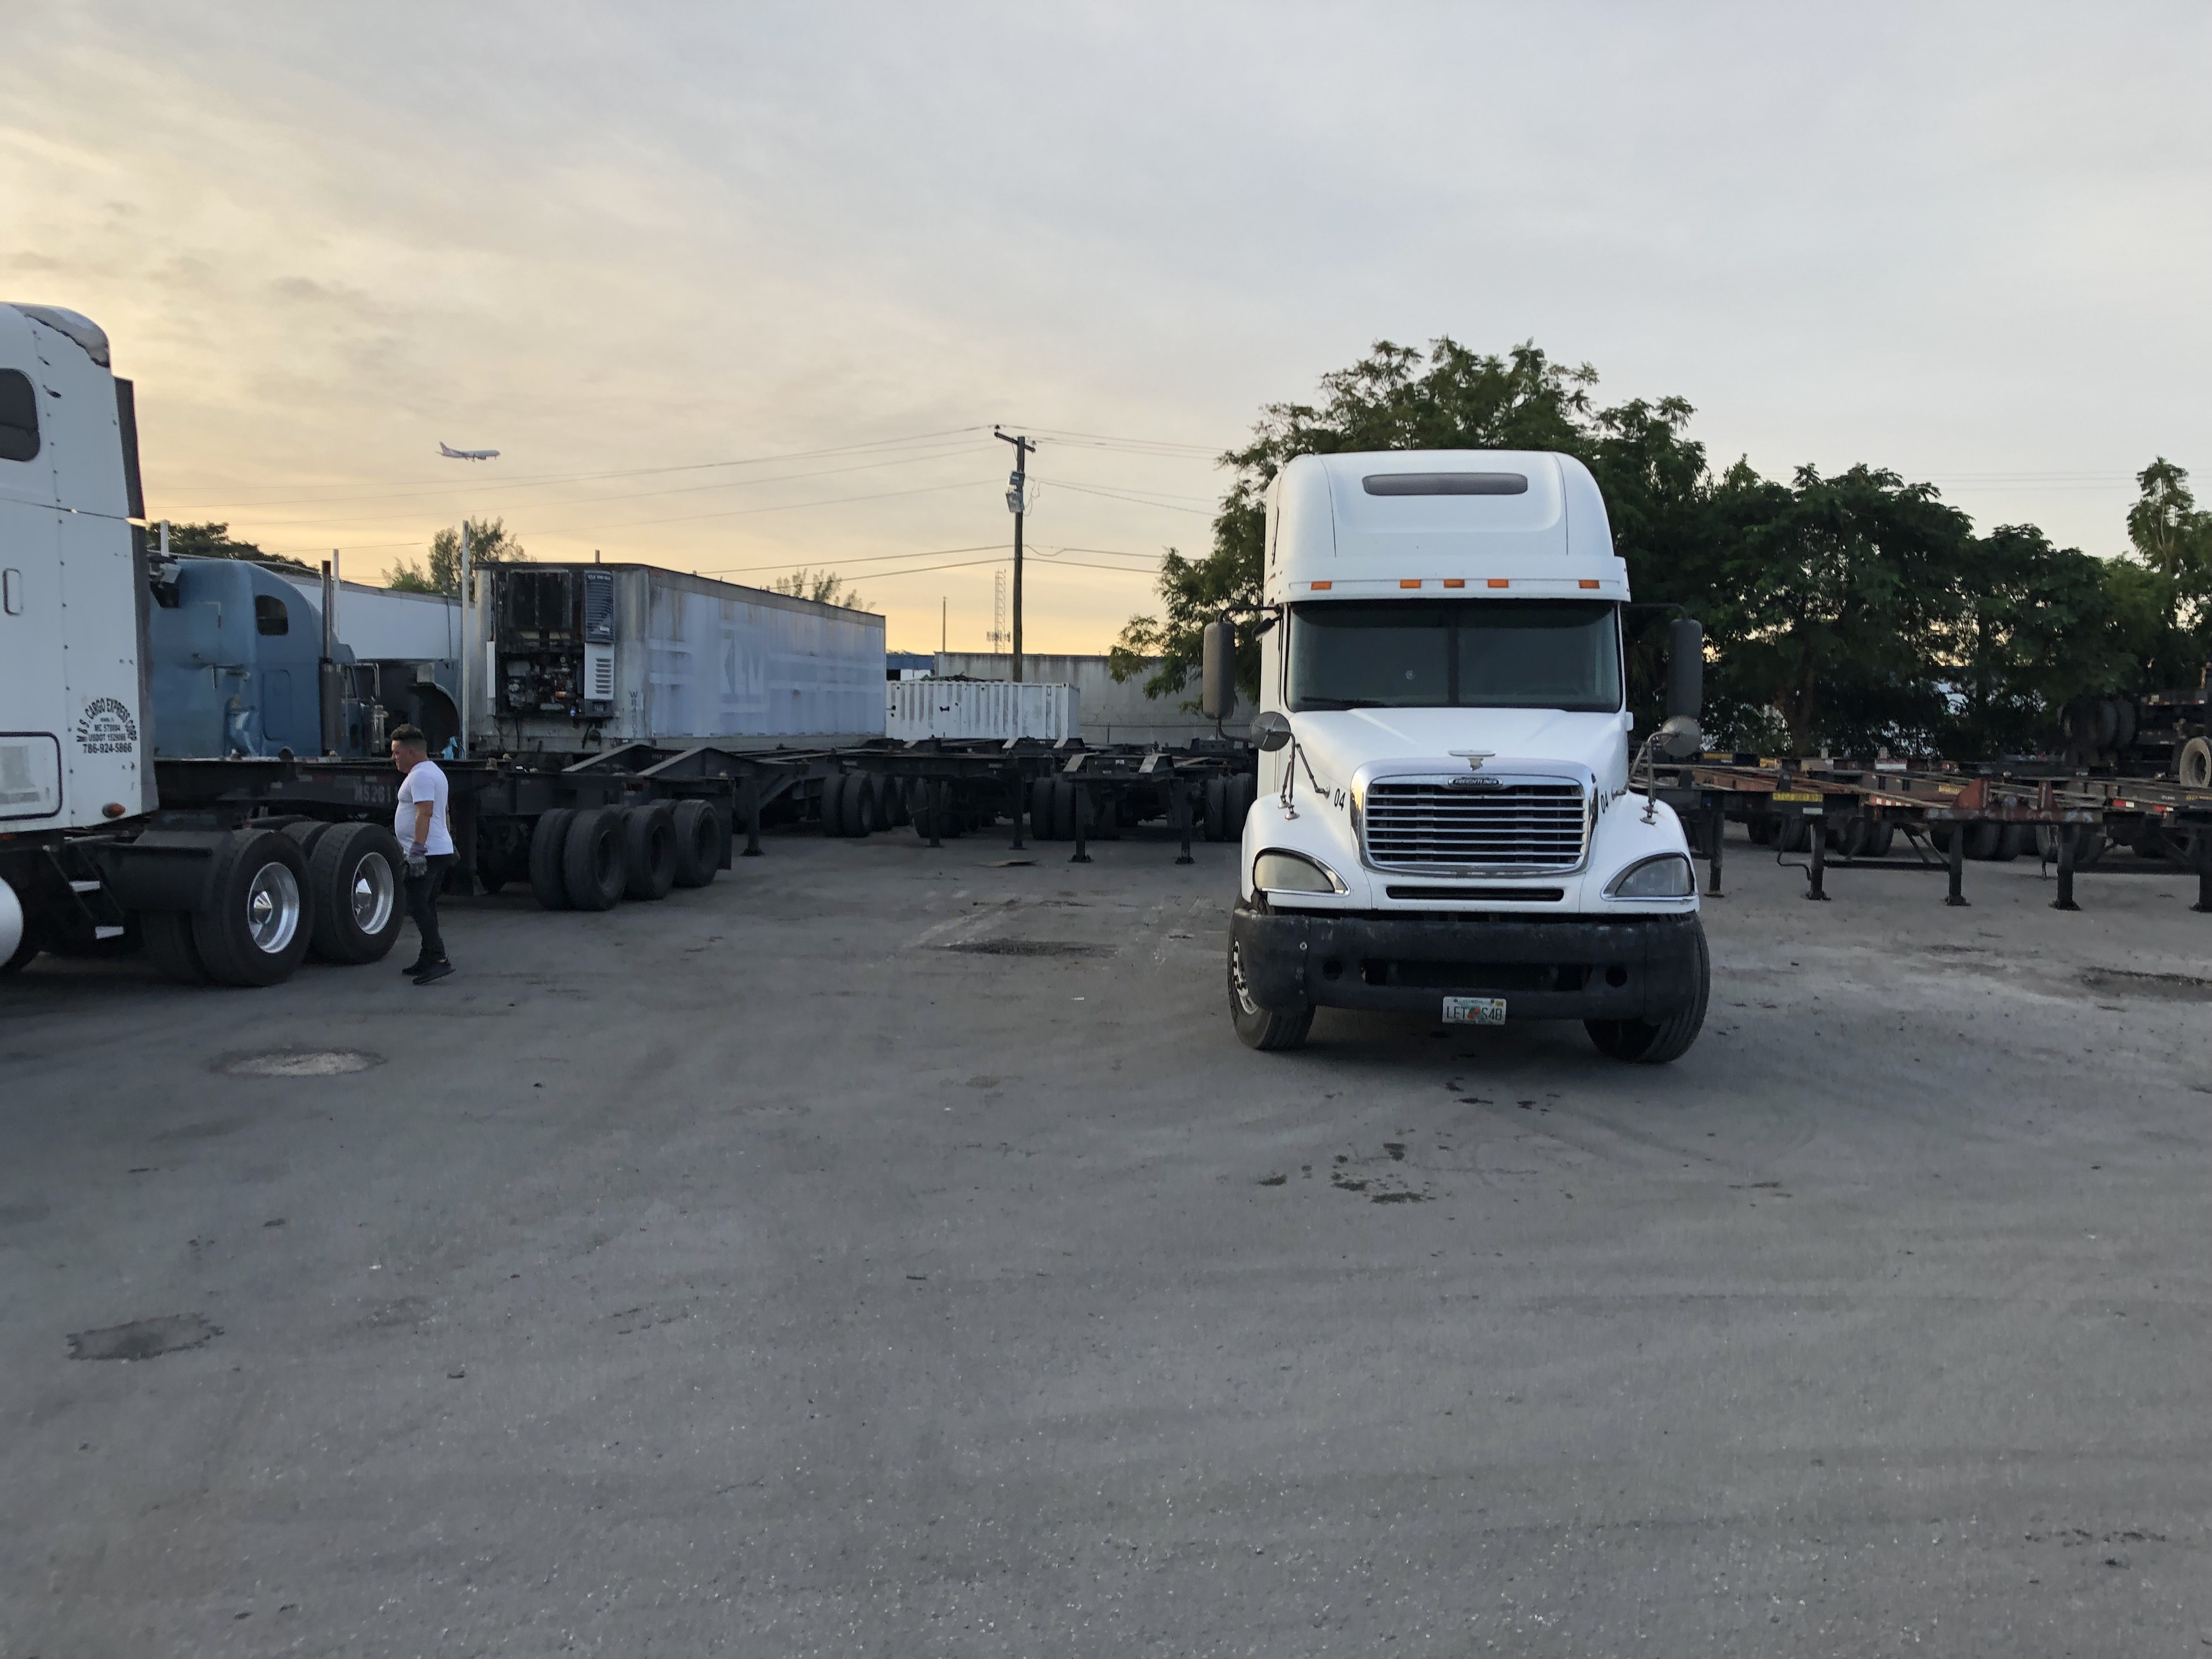
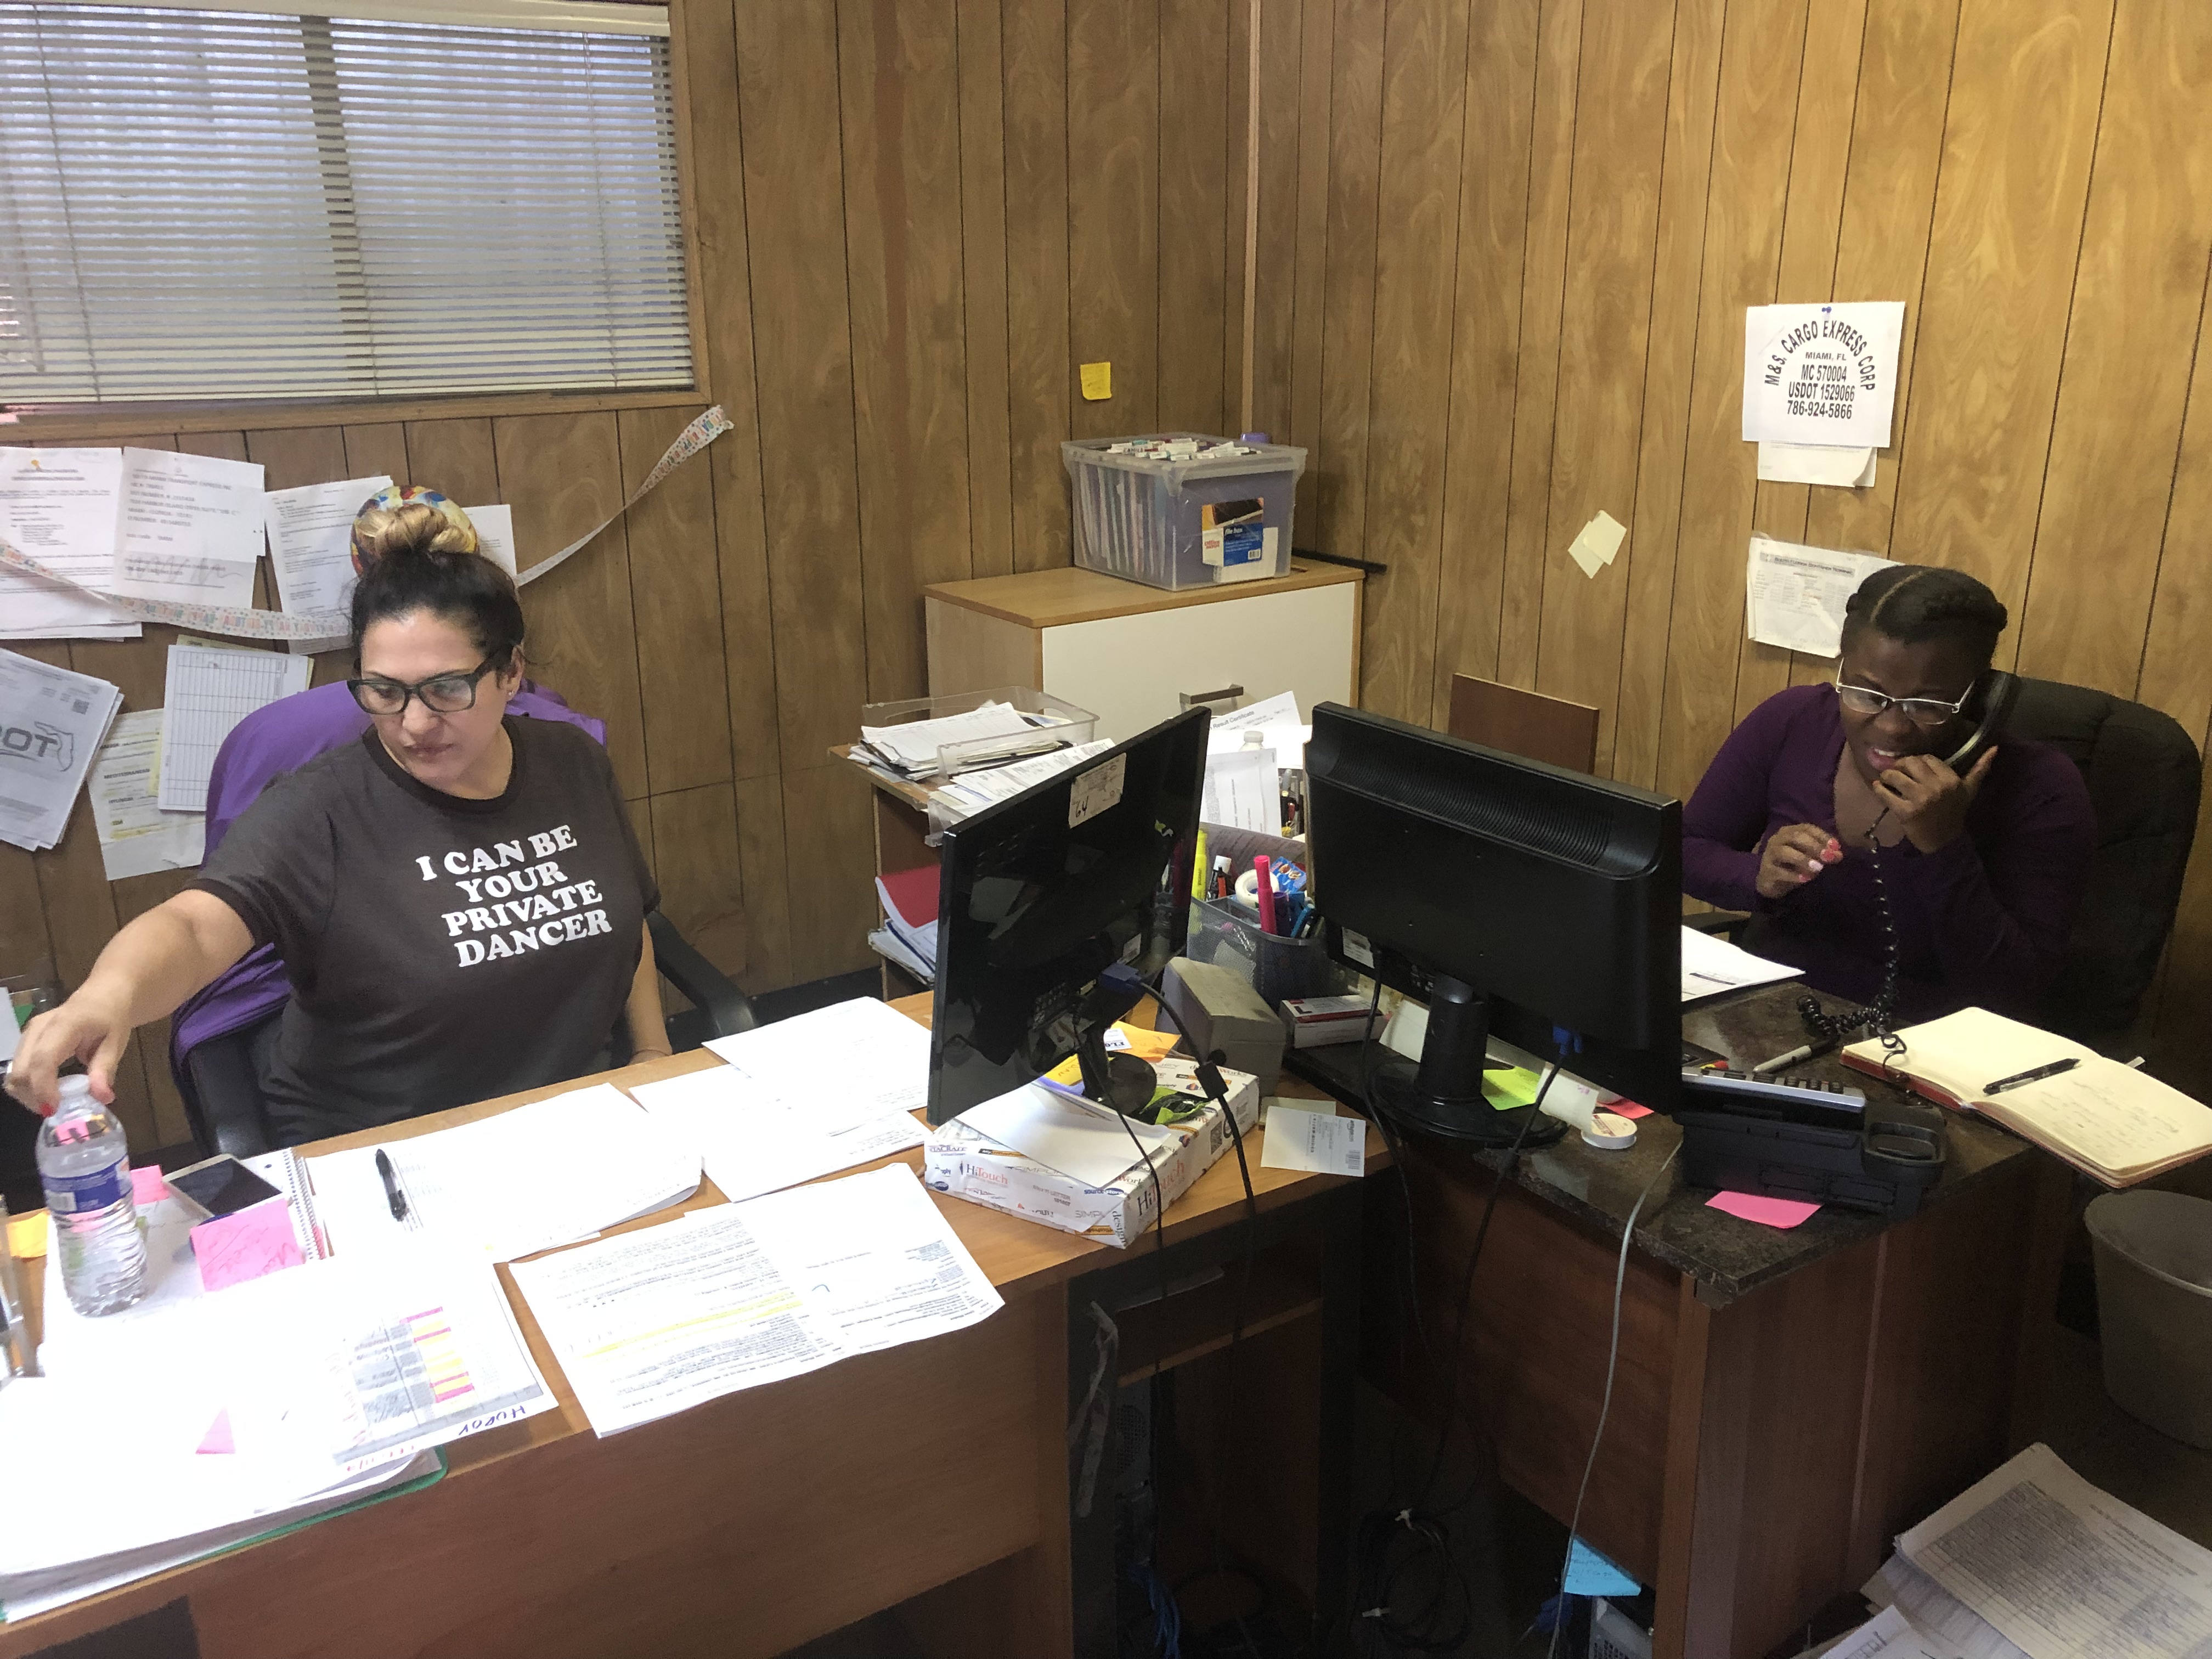
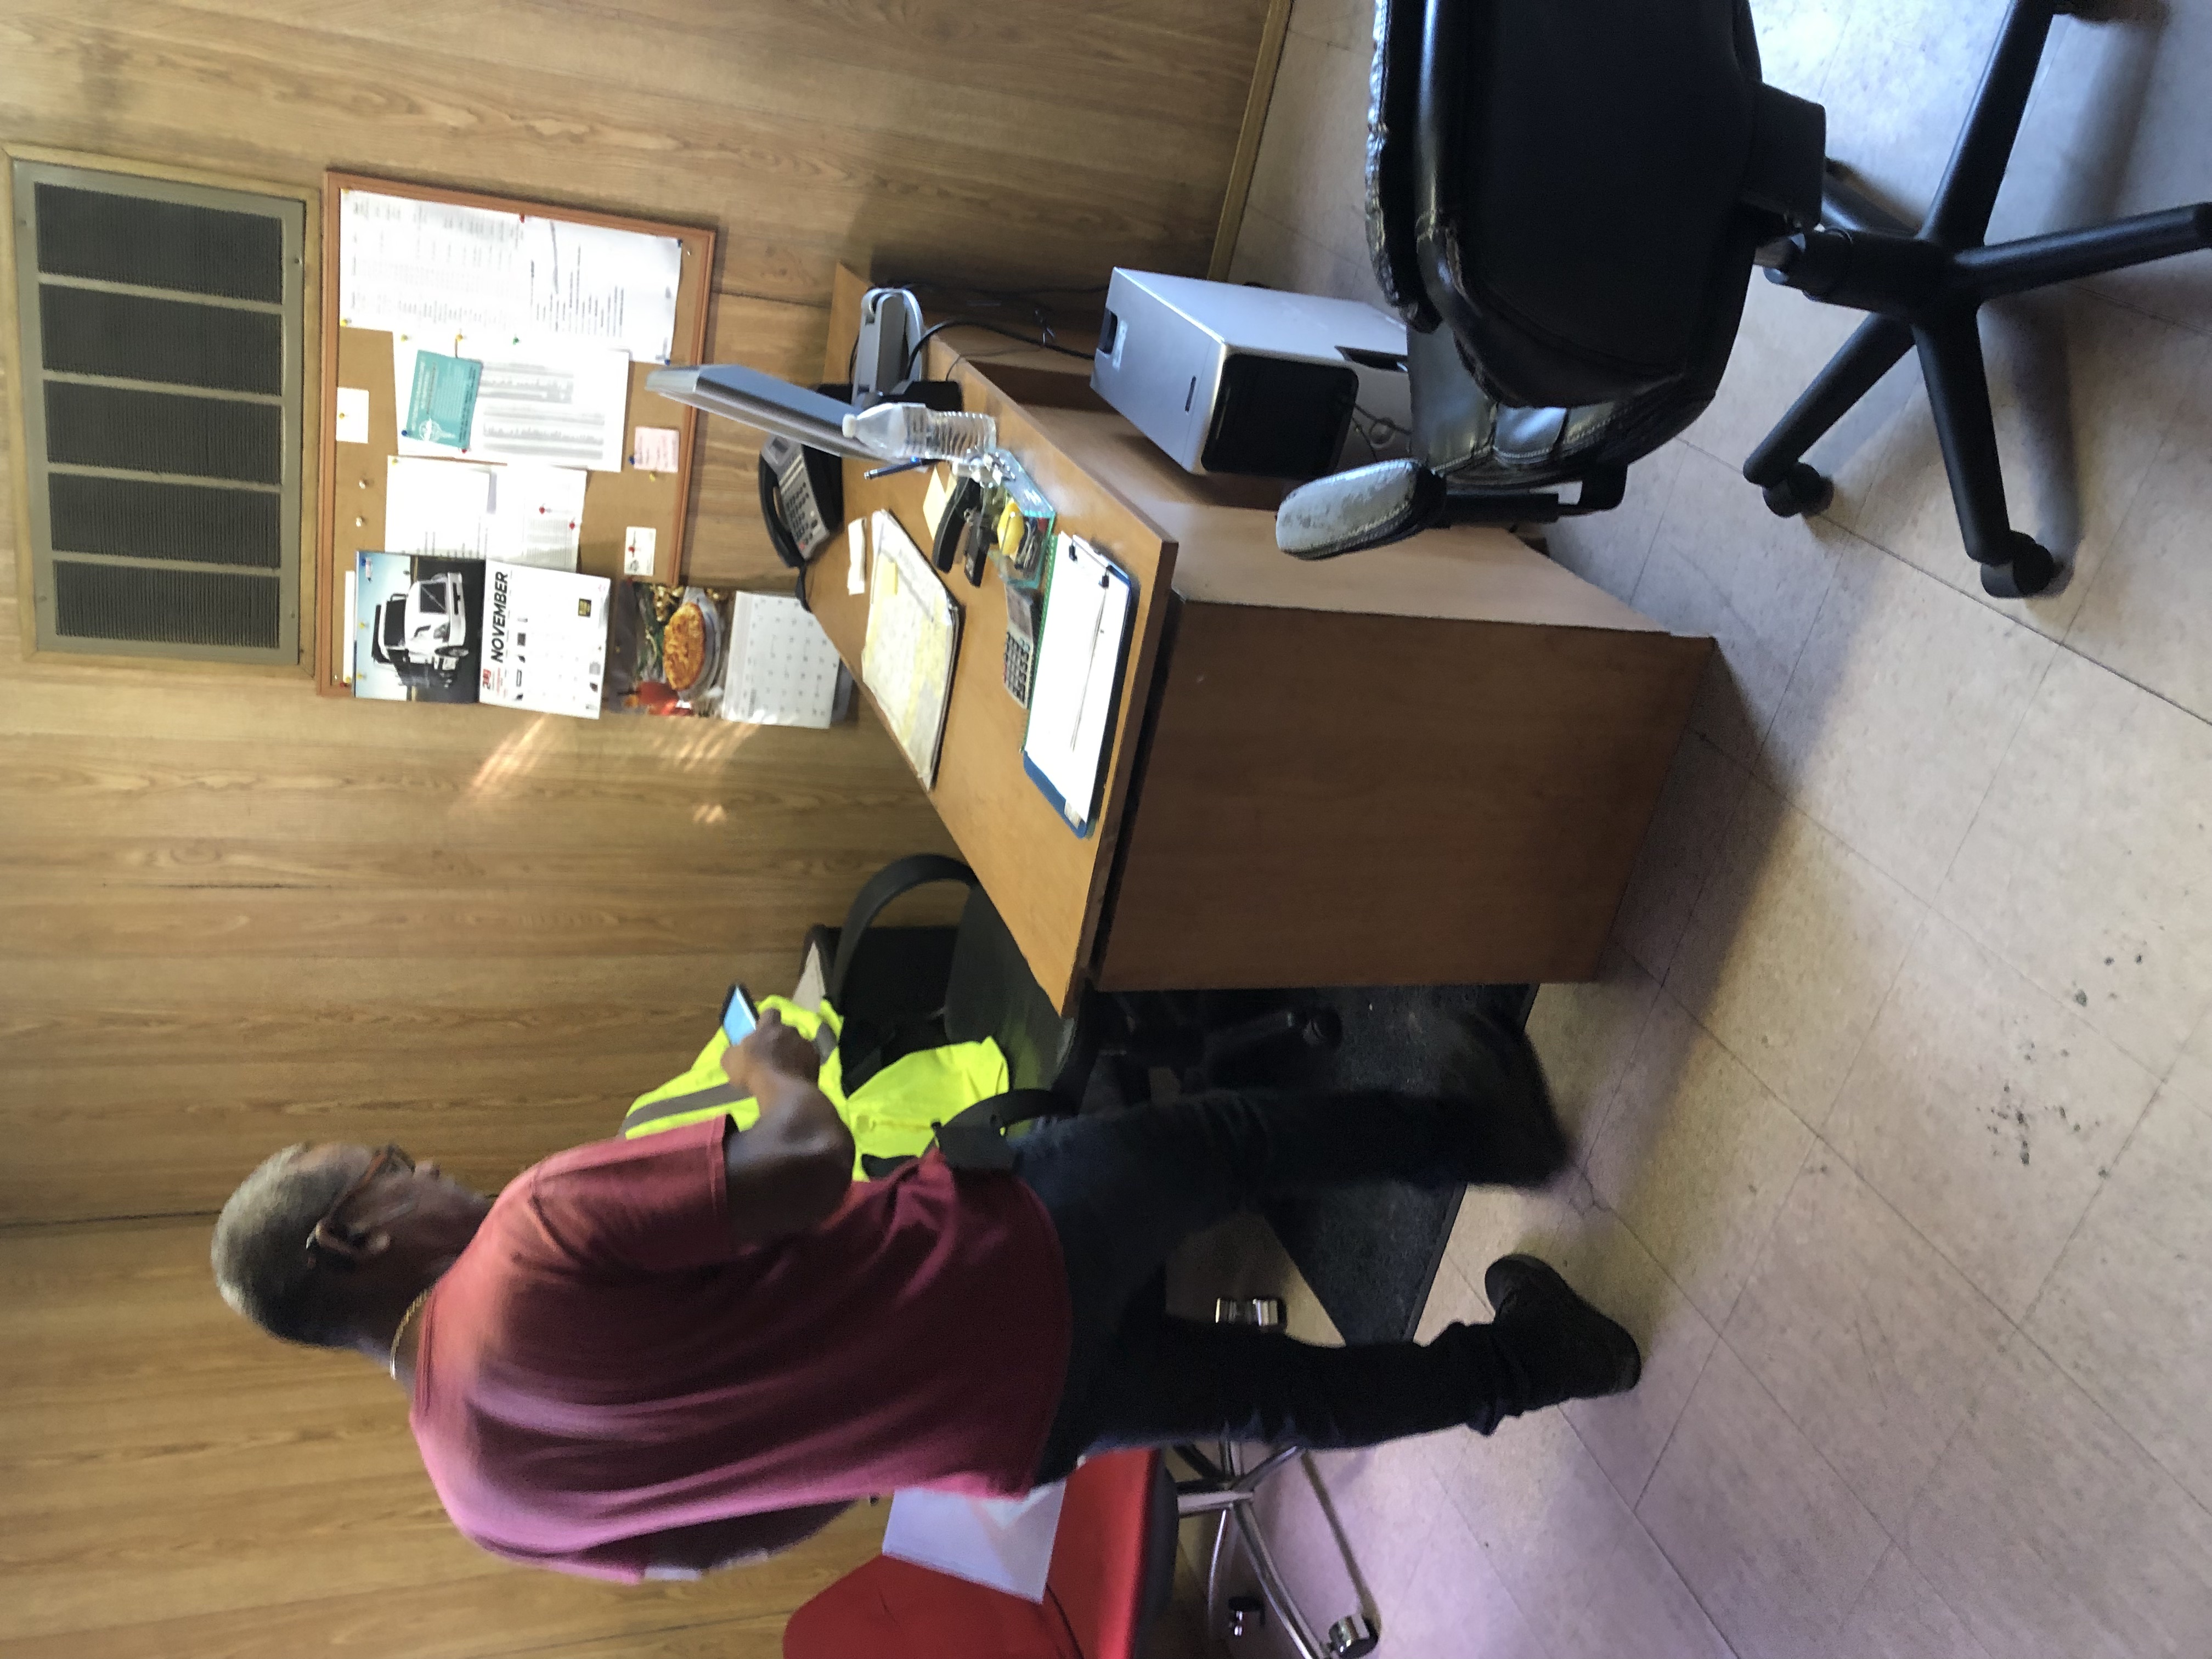
I had the pleasure of visiting one of the companies that was already using the software, in order to observe and find insights relating to the following learning goals:
I placed all the field notes, and notes from recordings to map out the themes.
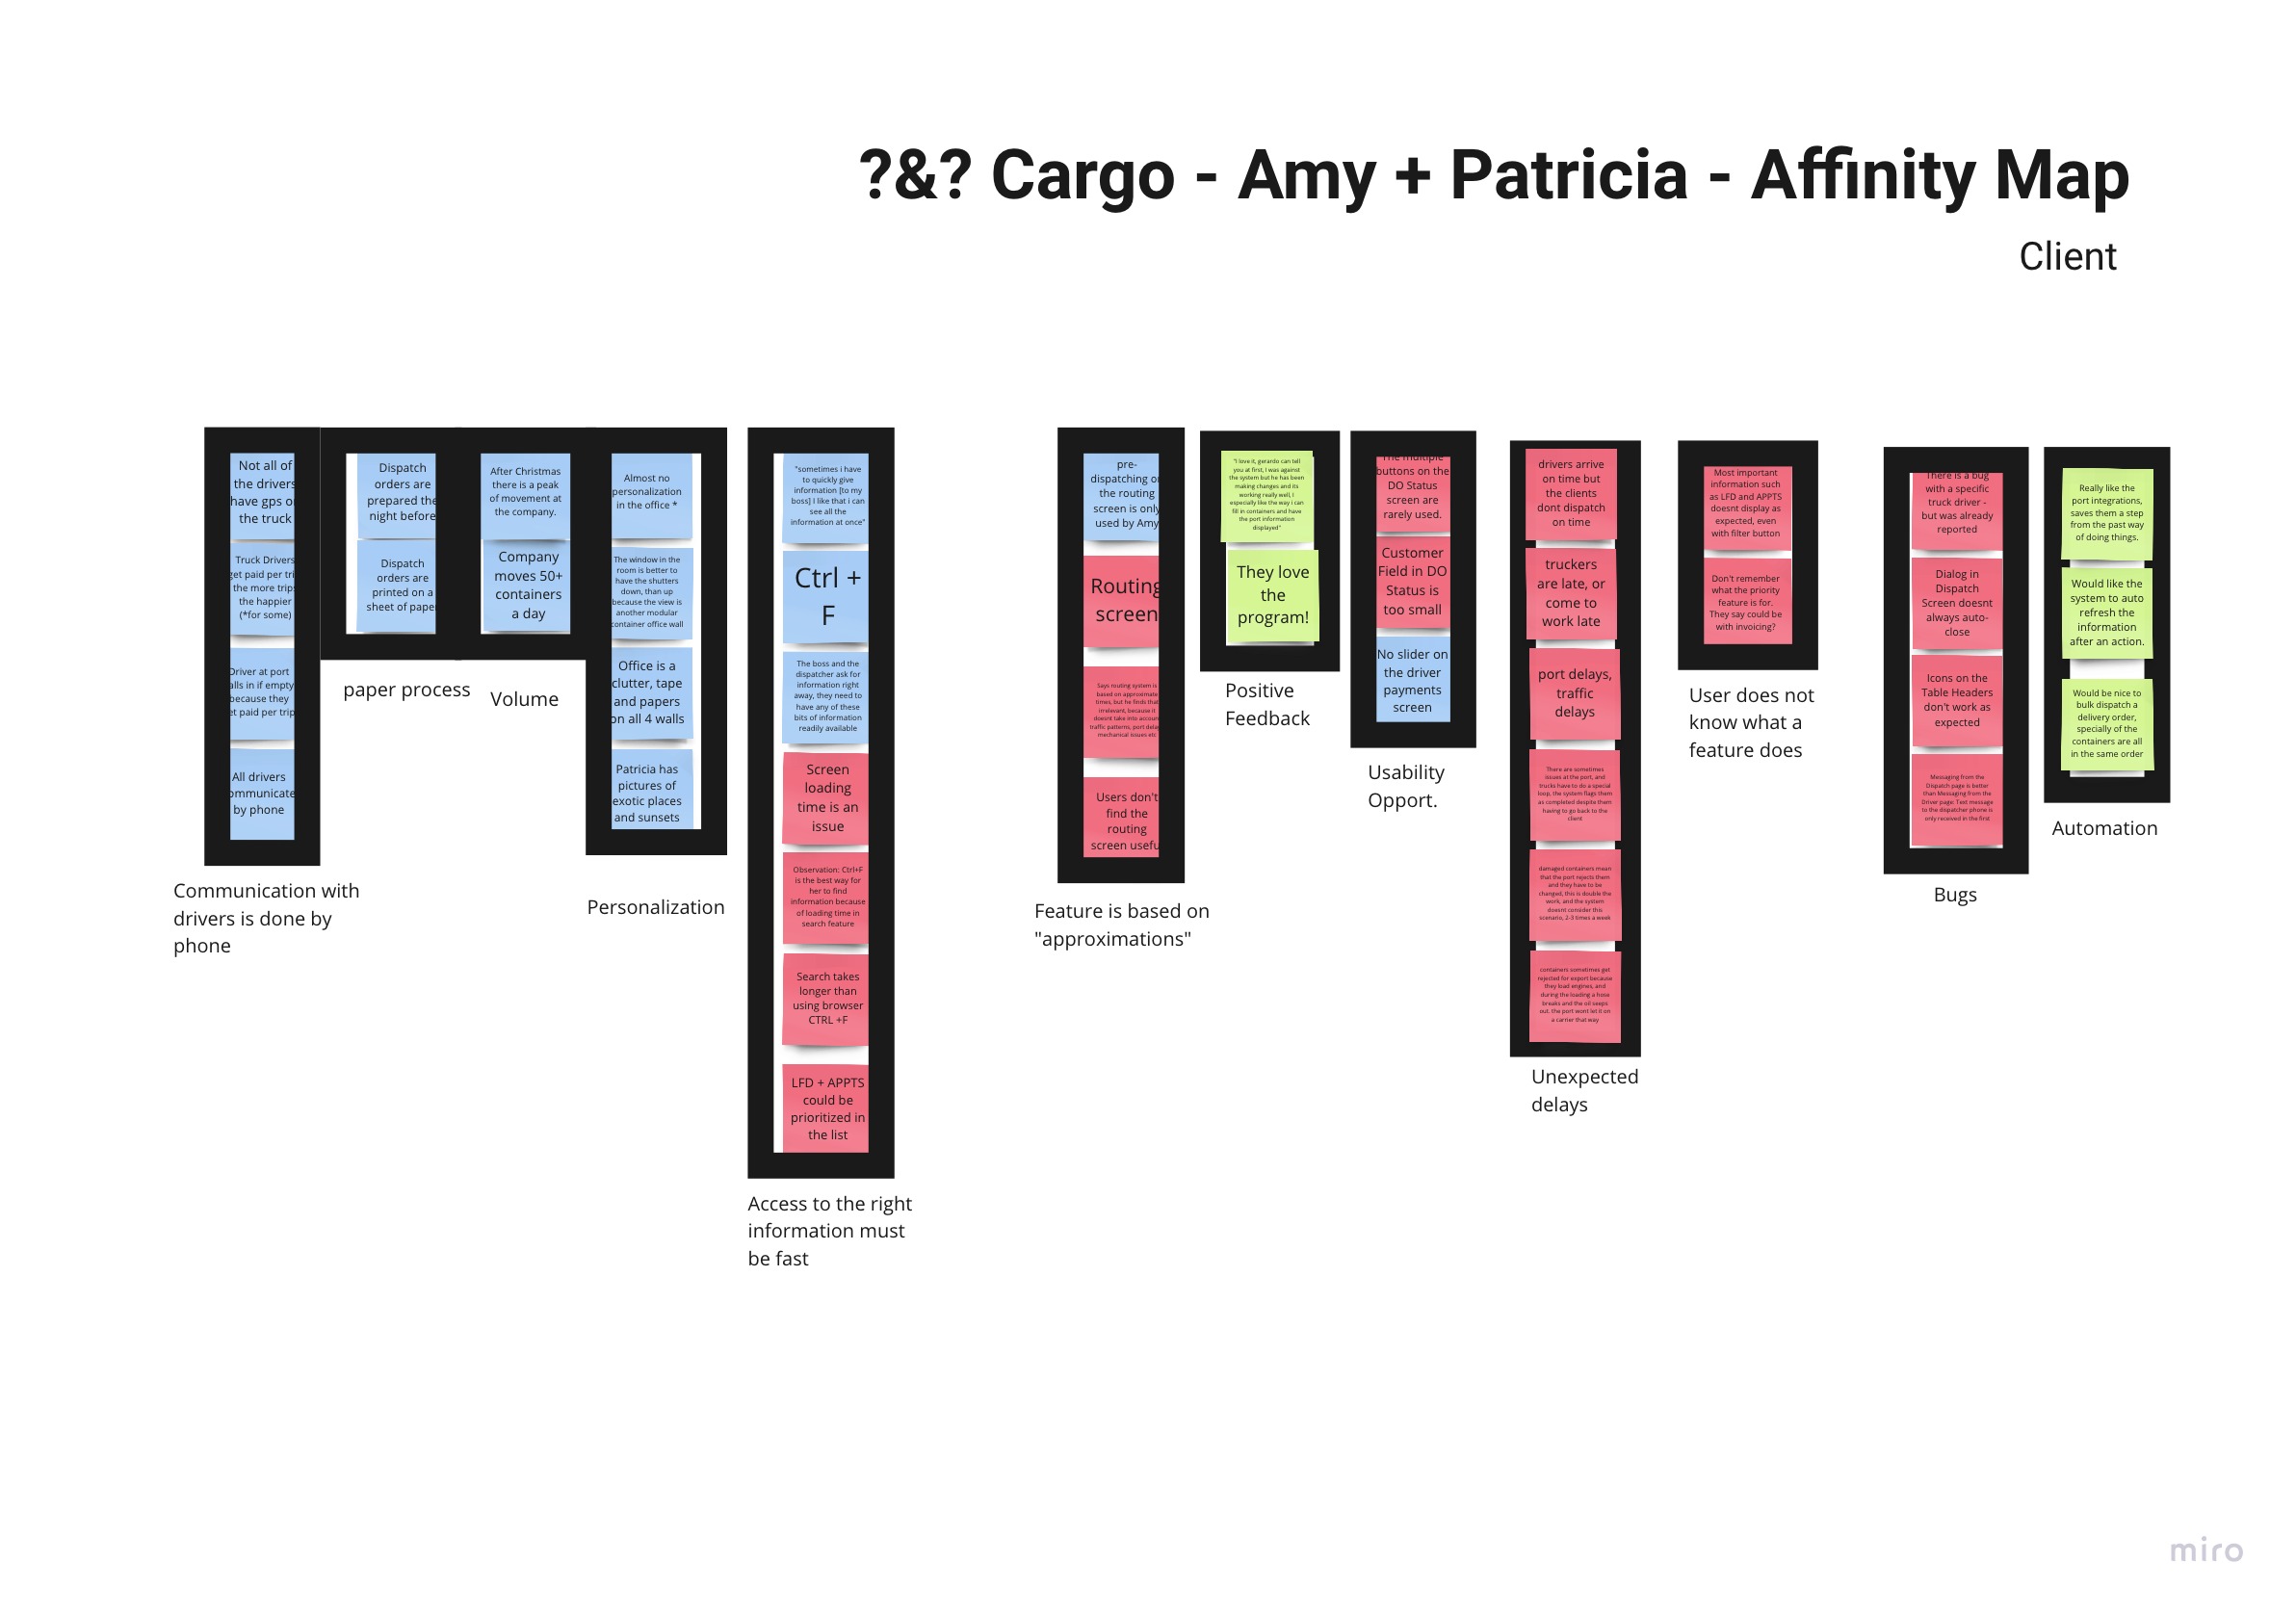
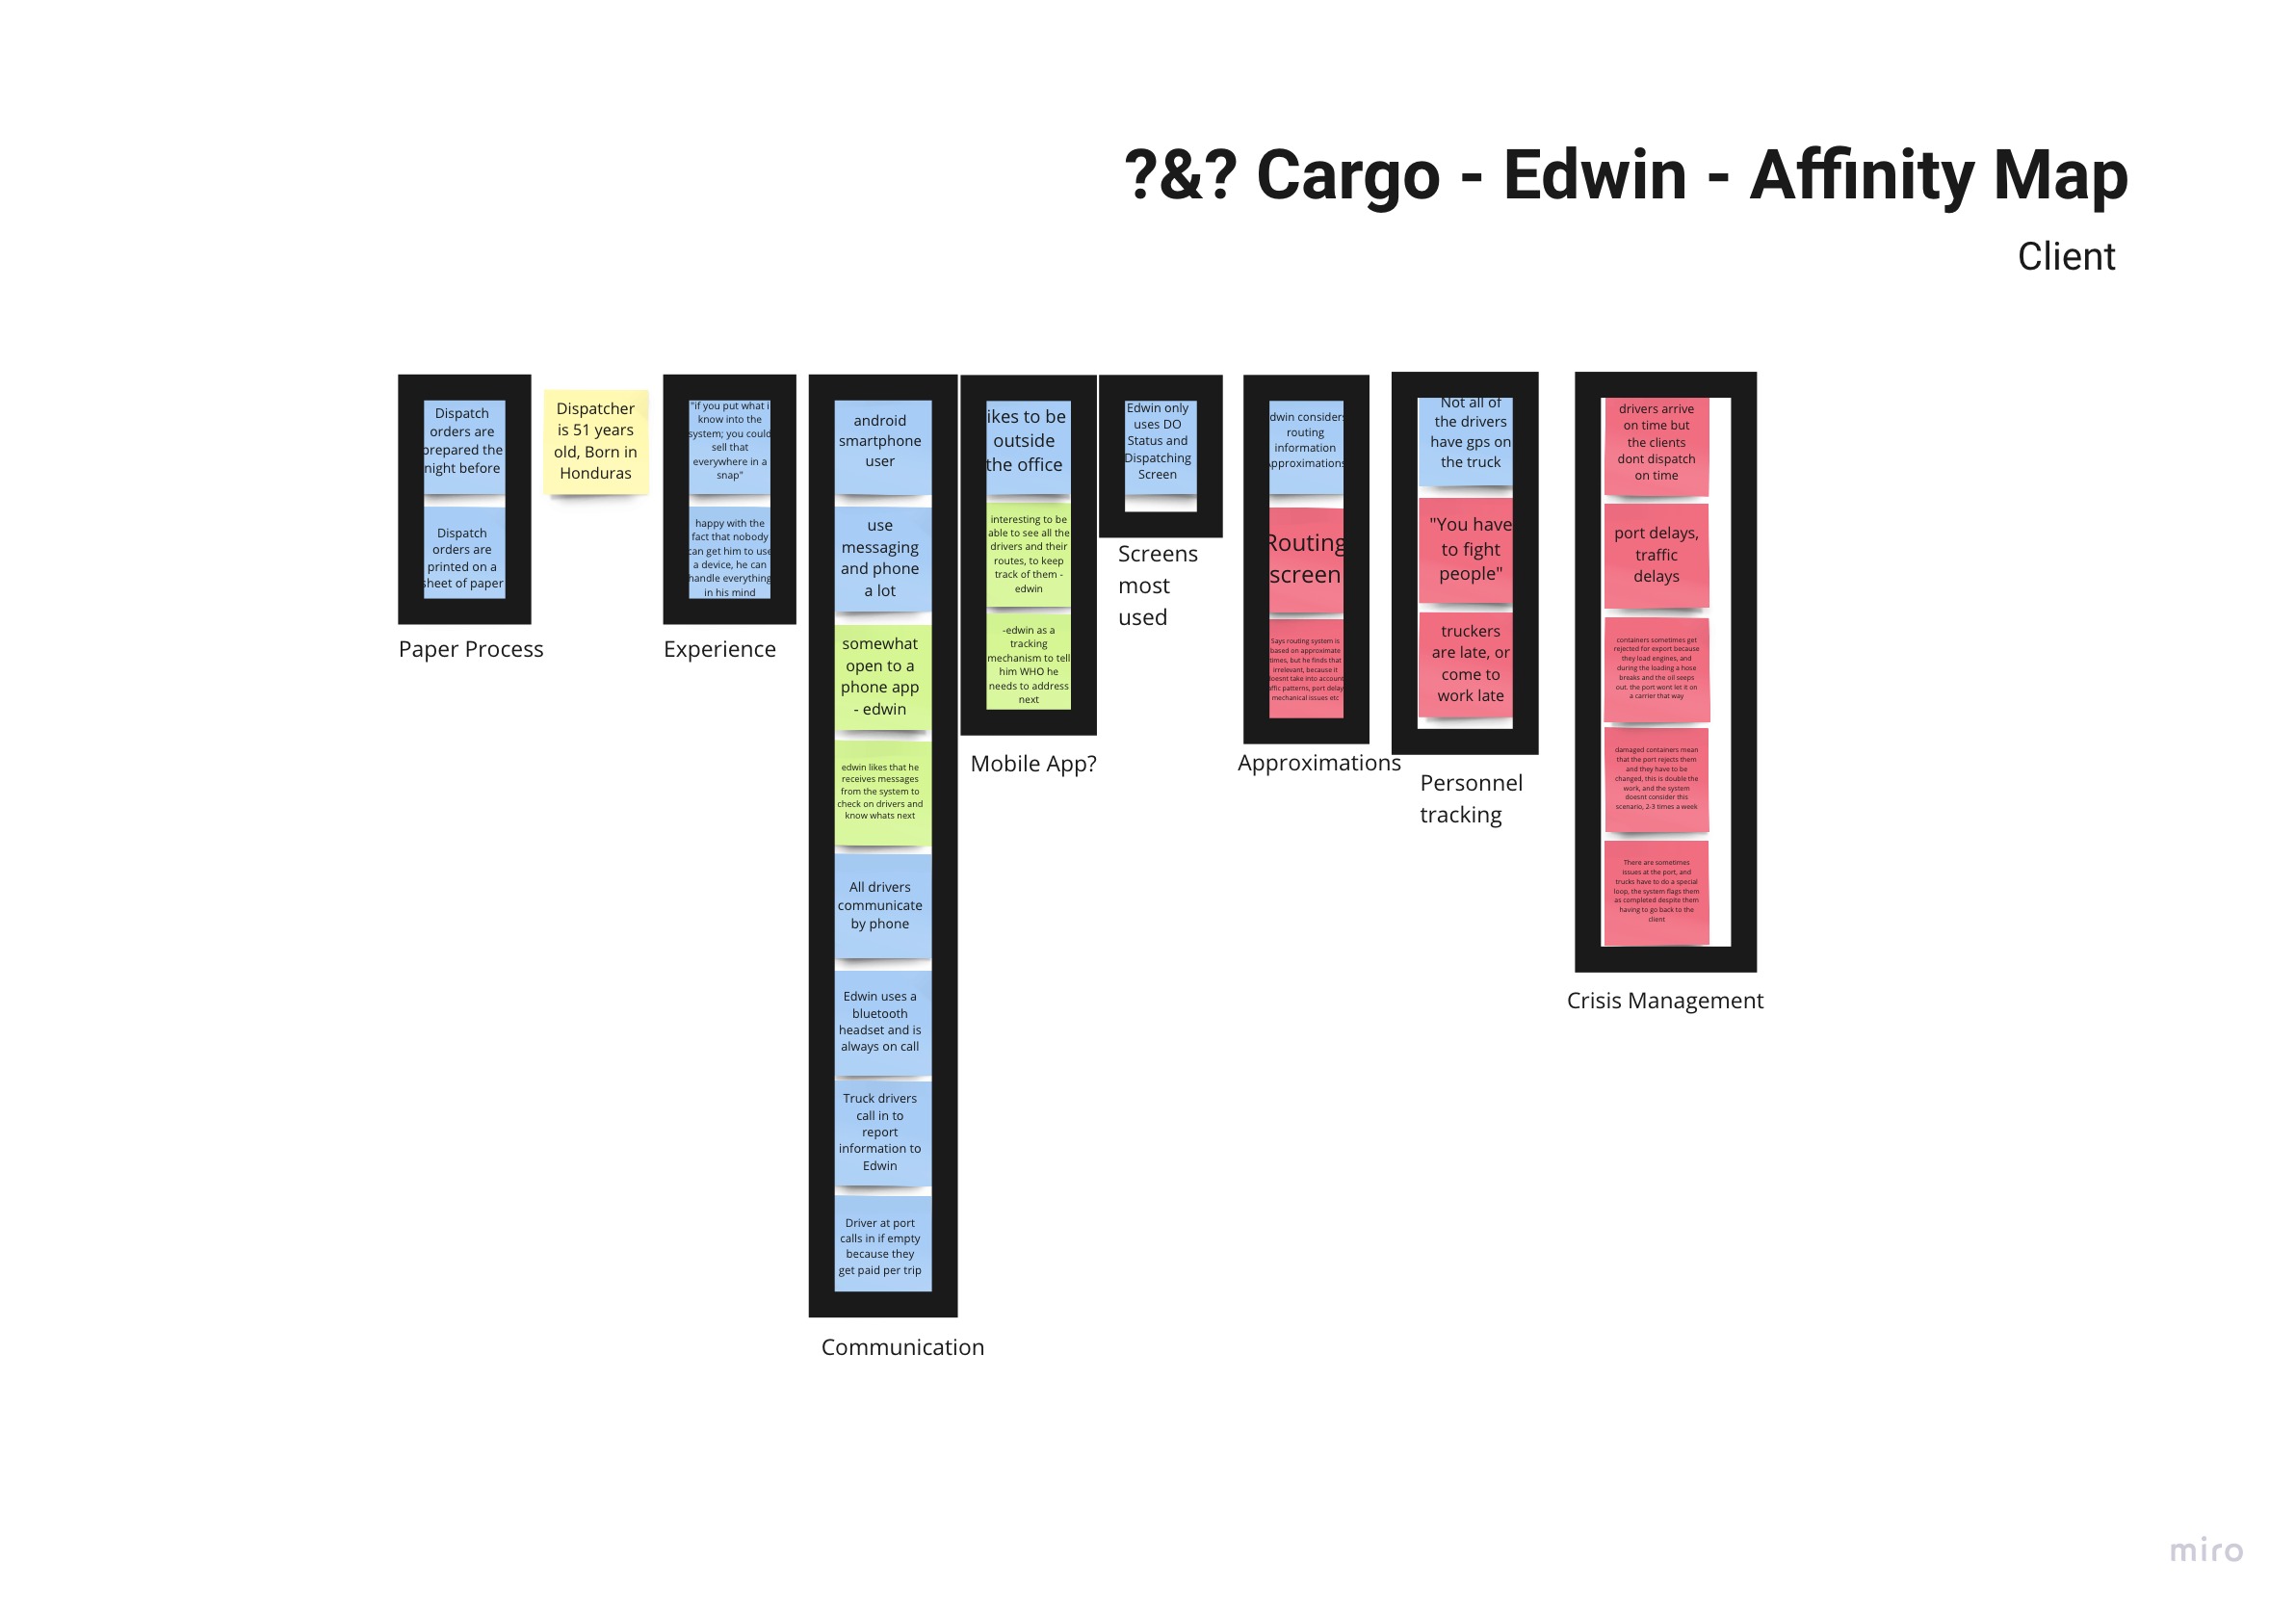
The insights that really stood out were the following:
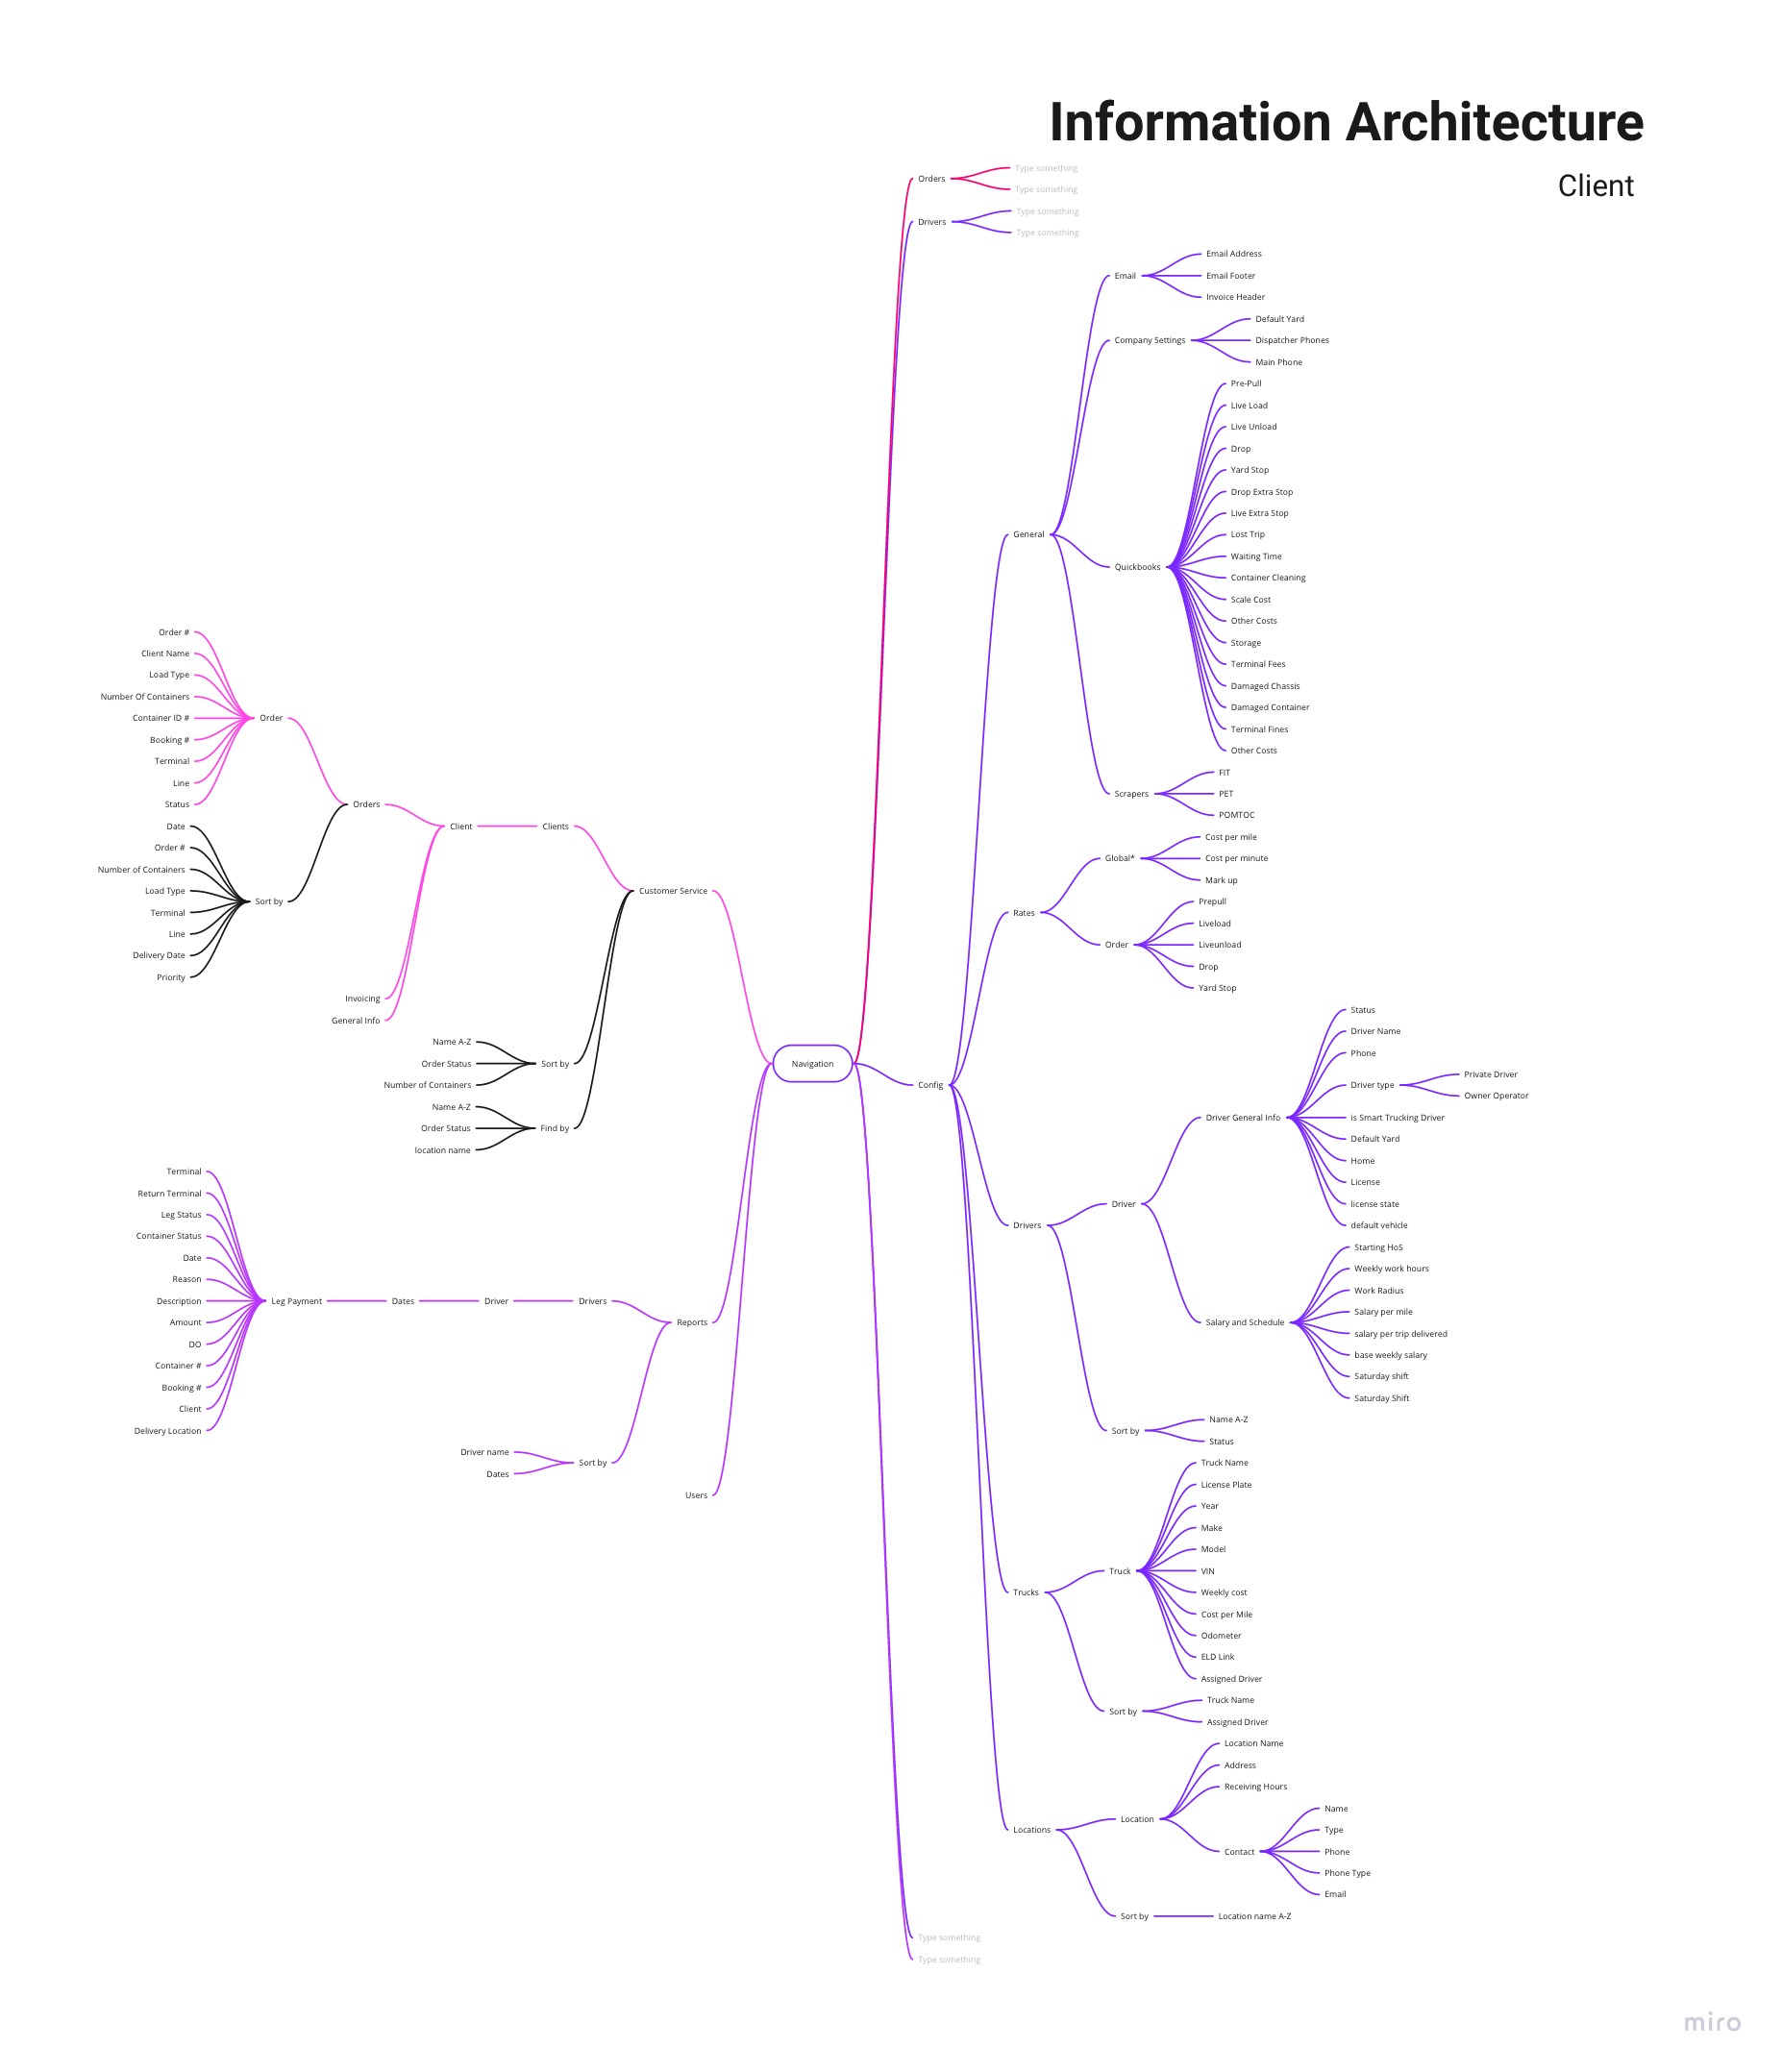
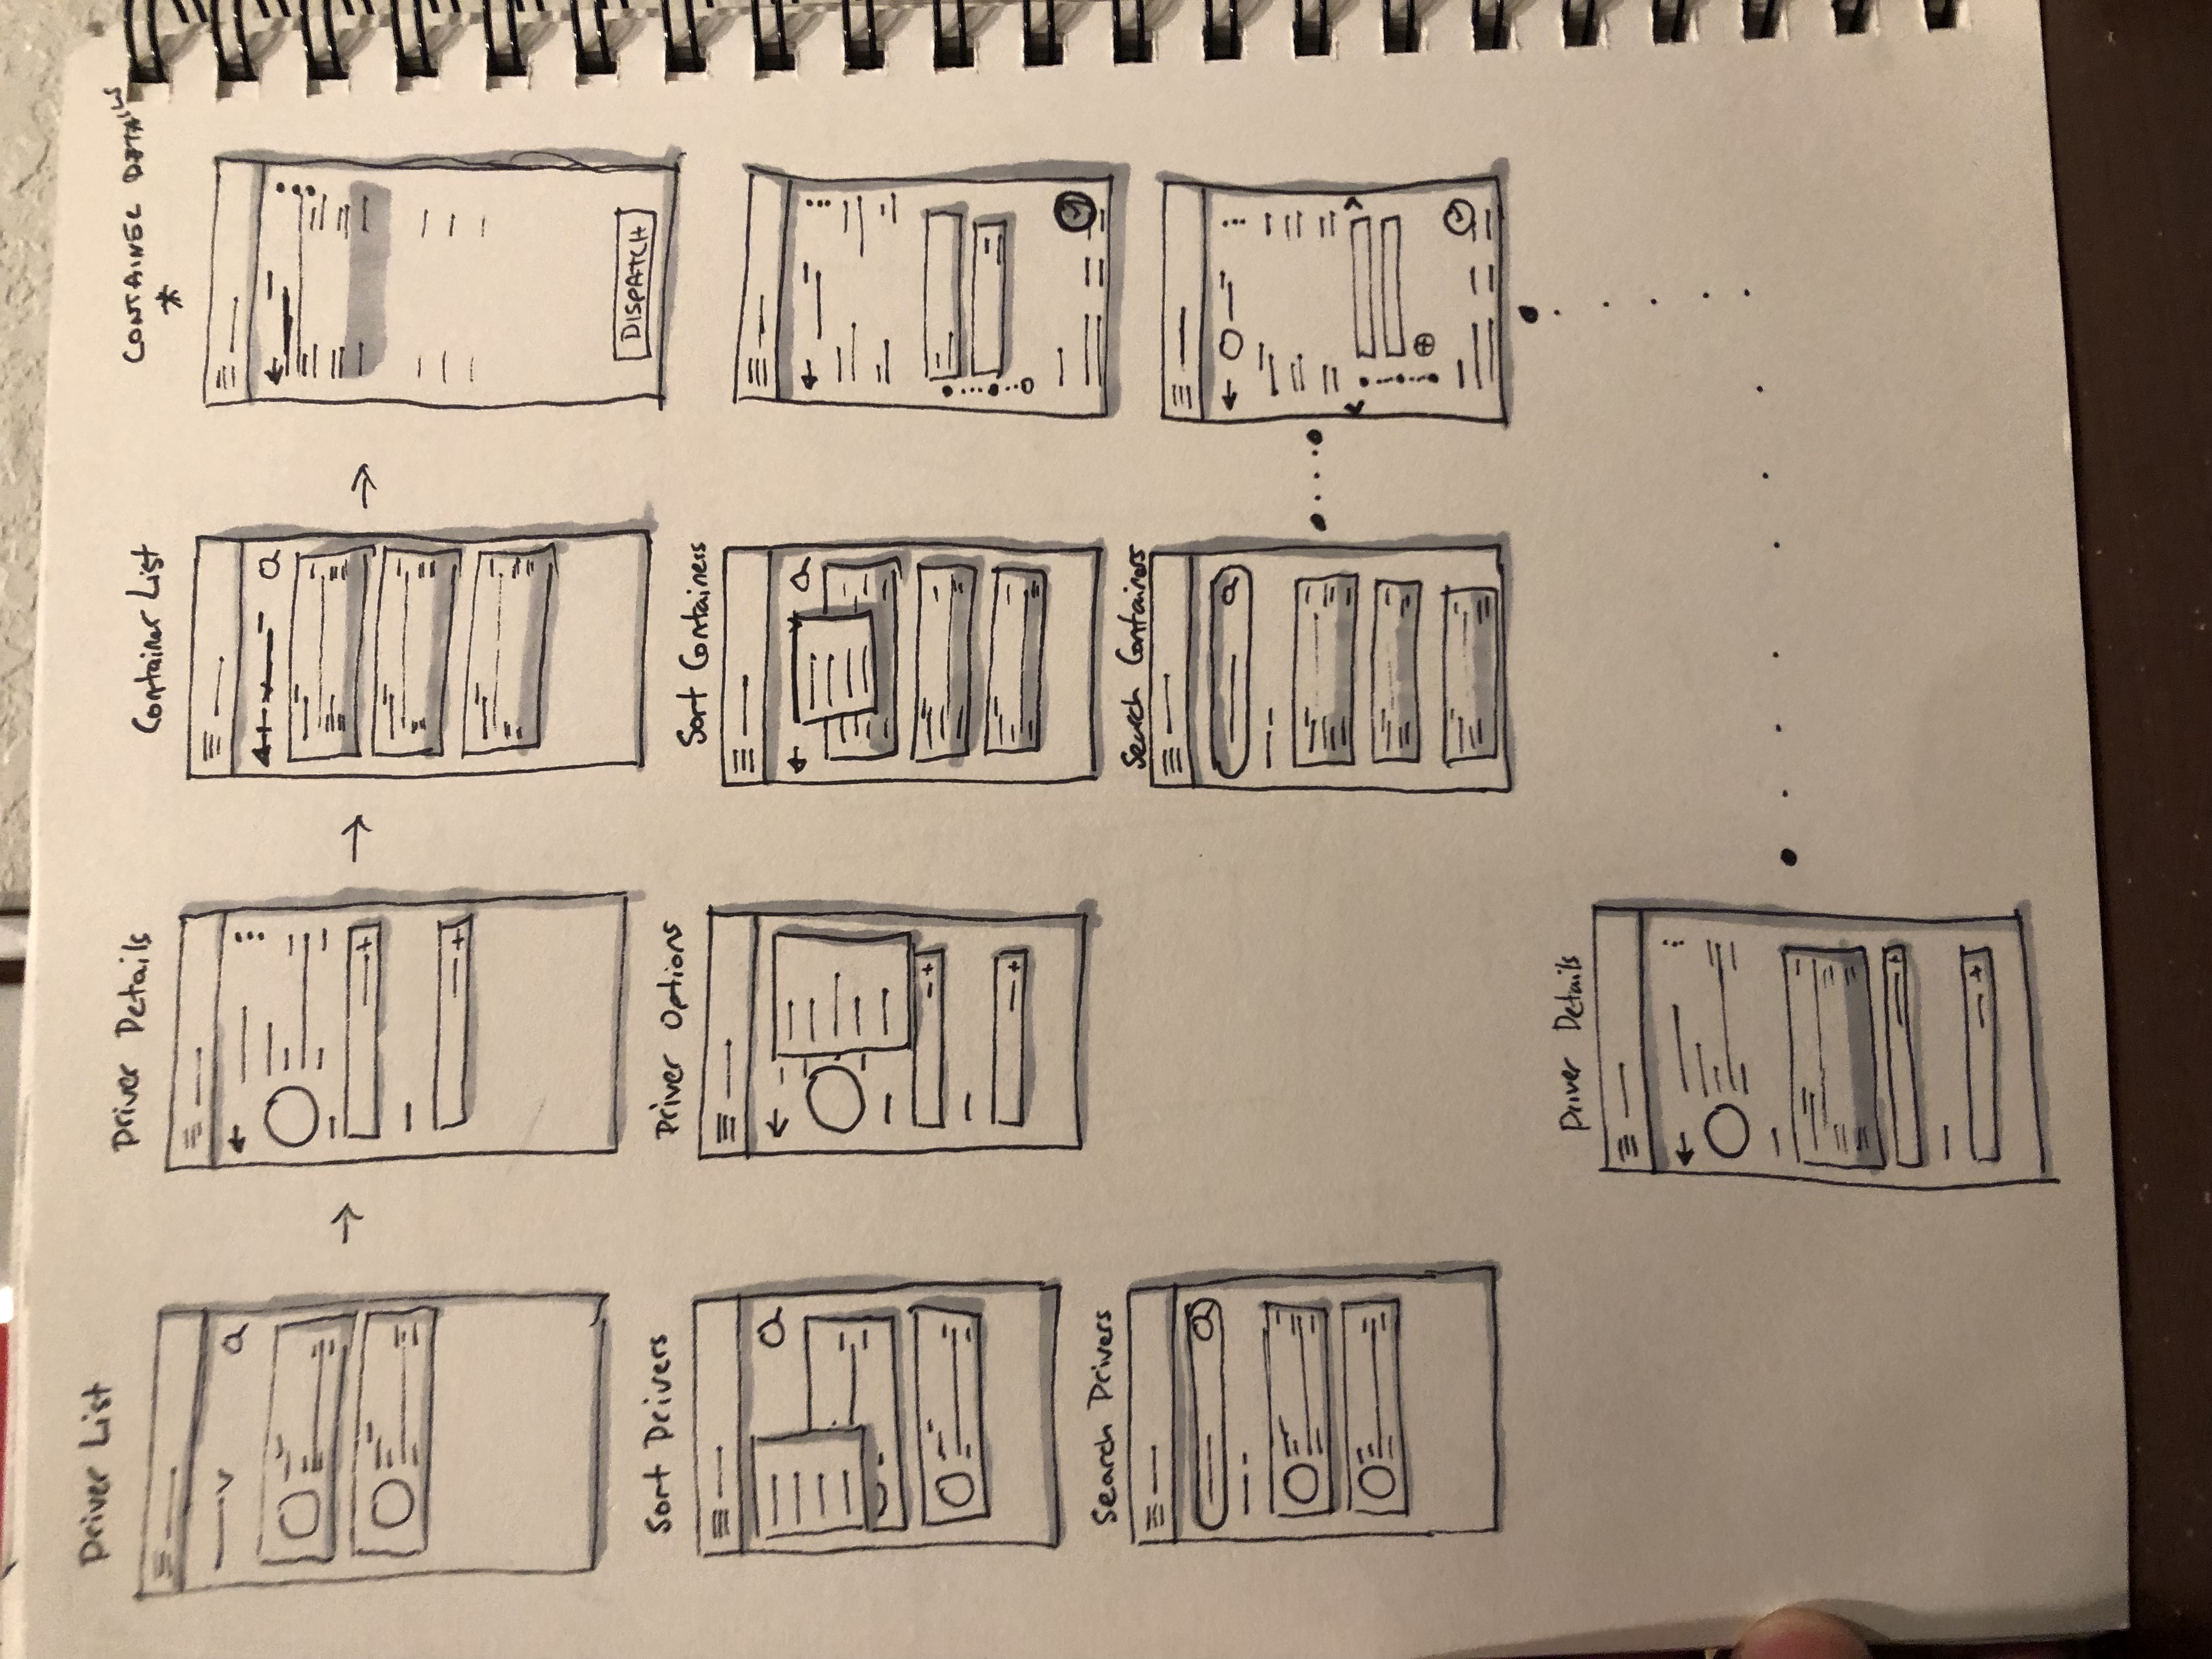
In this project I reported the insights to the project leader and was given direction to map out the components and site map of the application, in order to see where we could develop a better experience.
%201.png)
I discovered that the application was directed at looking at freight containers as the main item of the user's focus. When I asked further questions, this was an industry set standard going back to the early software applications in the field. Where the process of dispatching focused on the movement of containers, a Container-based approach while the driver was of secondary importance. Not only that, at many points during my visit with the users, a true insight had been there all along in the ways the users spoke.
The user's have a mental model, shown by the way they speak that is actually Driver-based. As such so should the application.
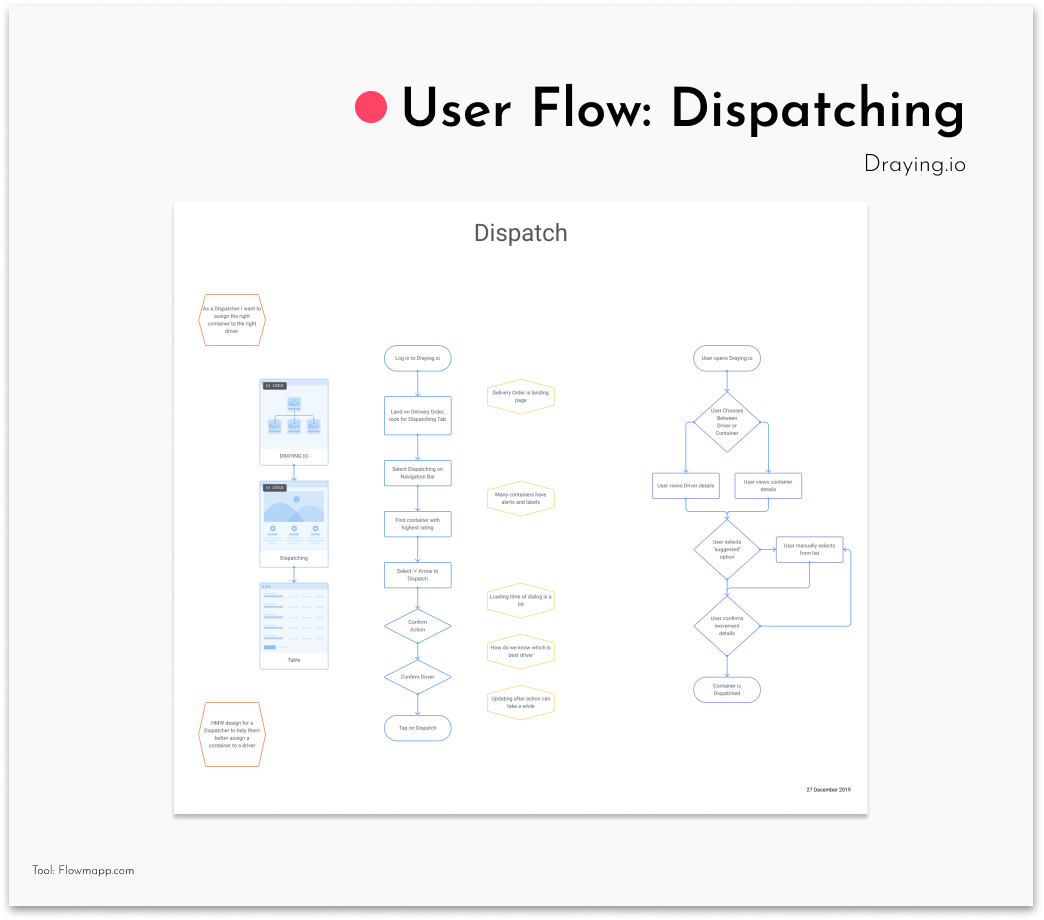
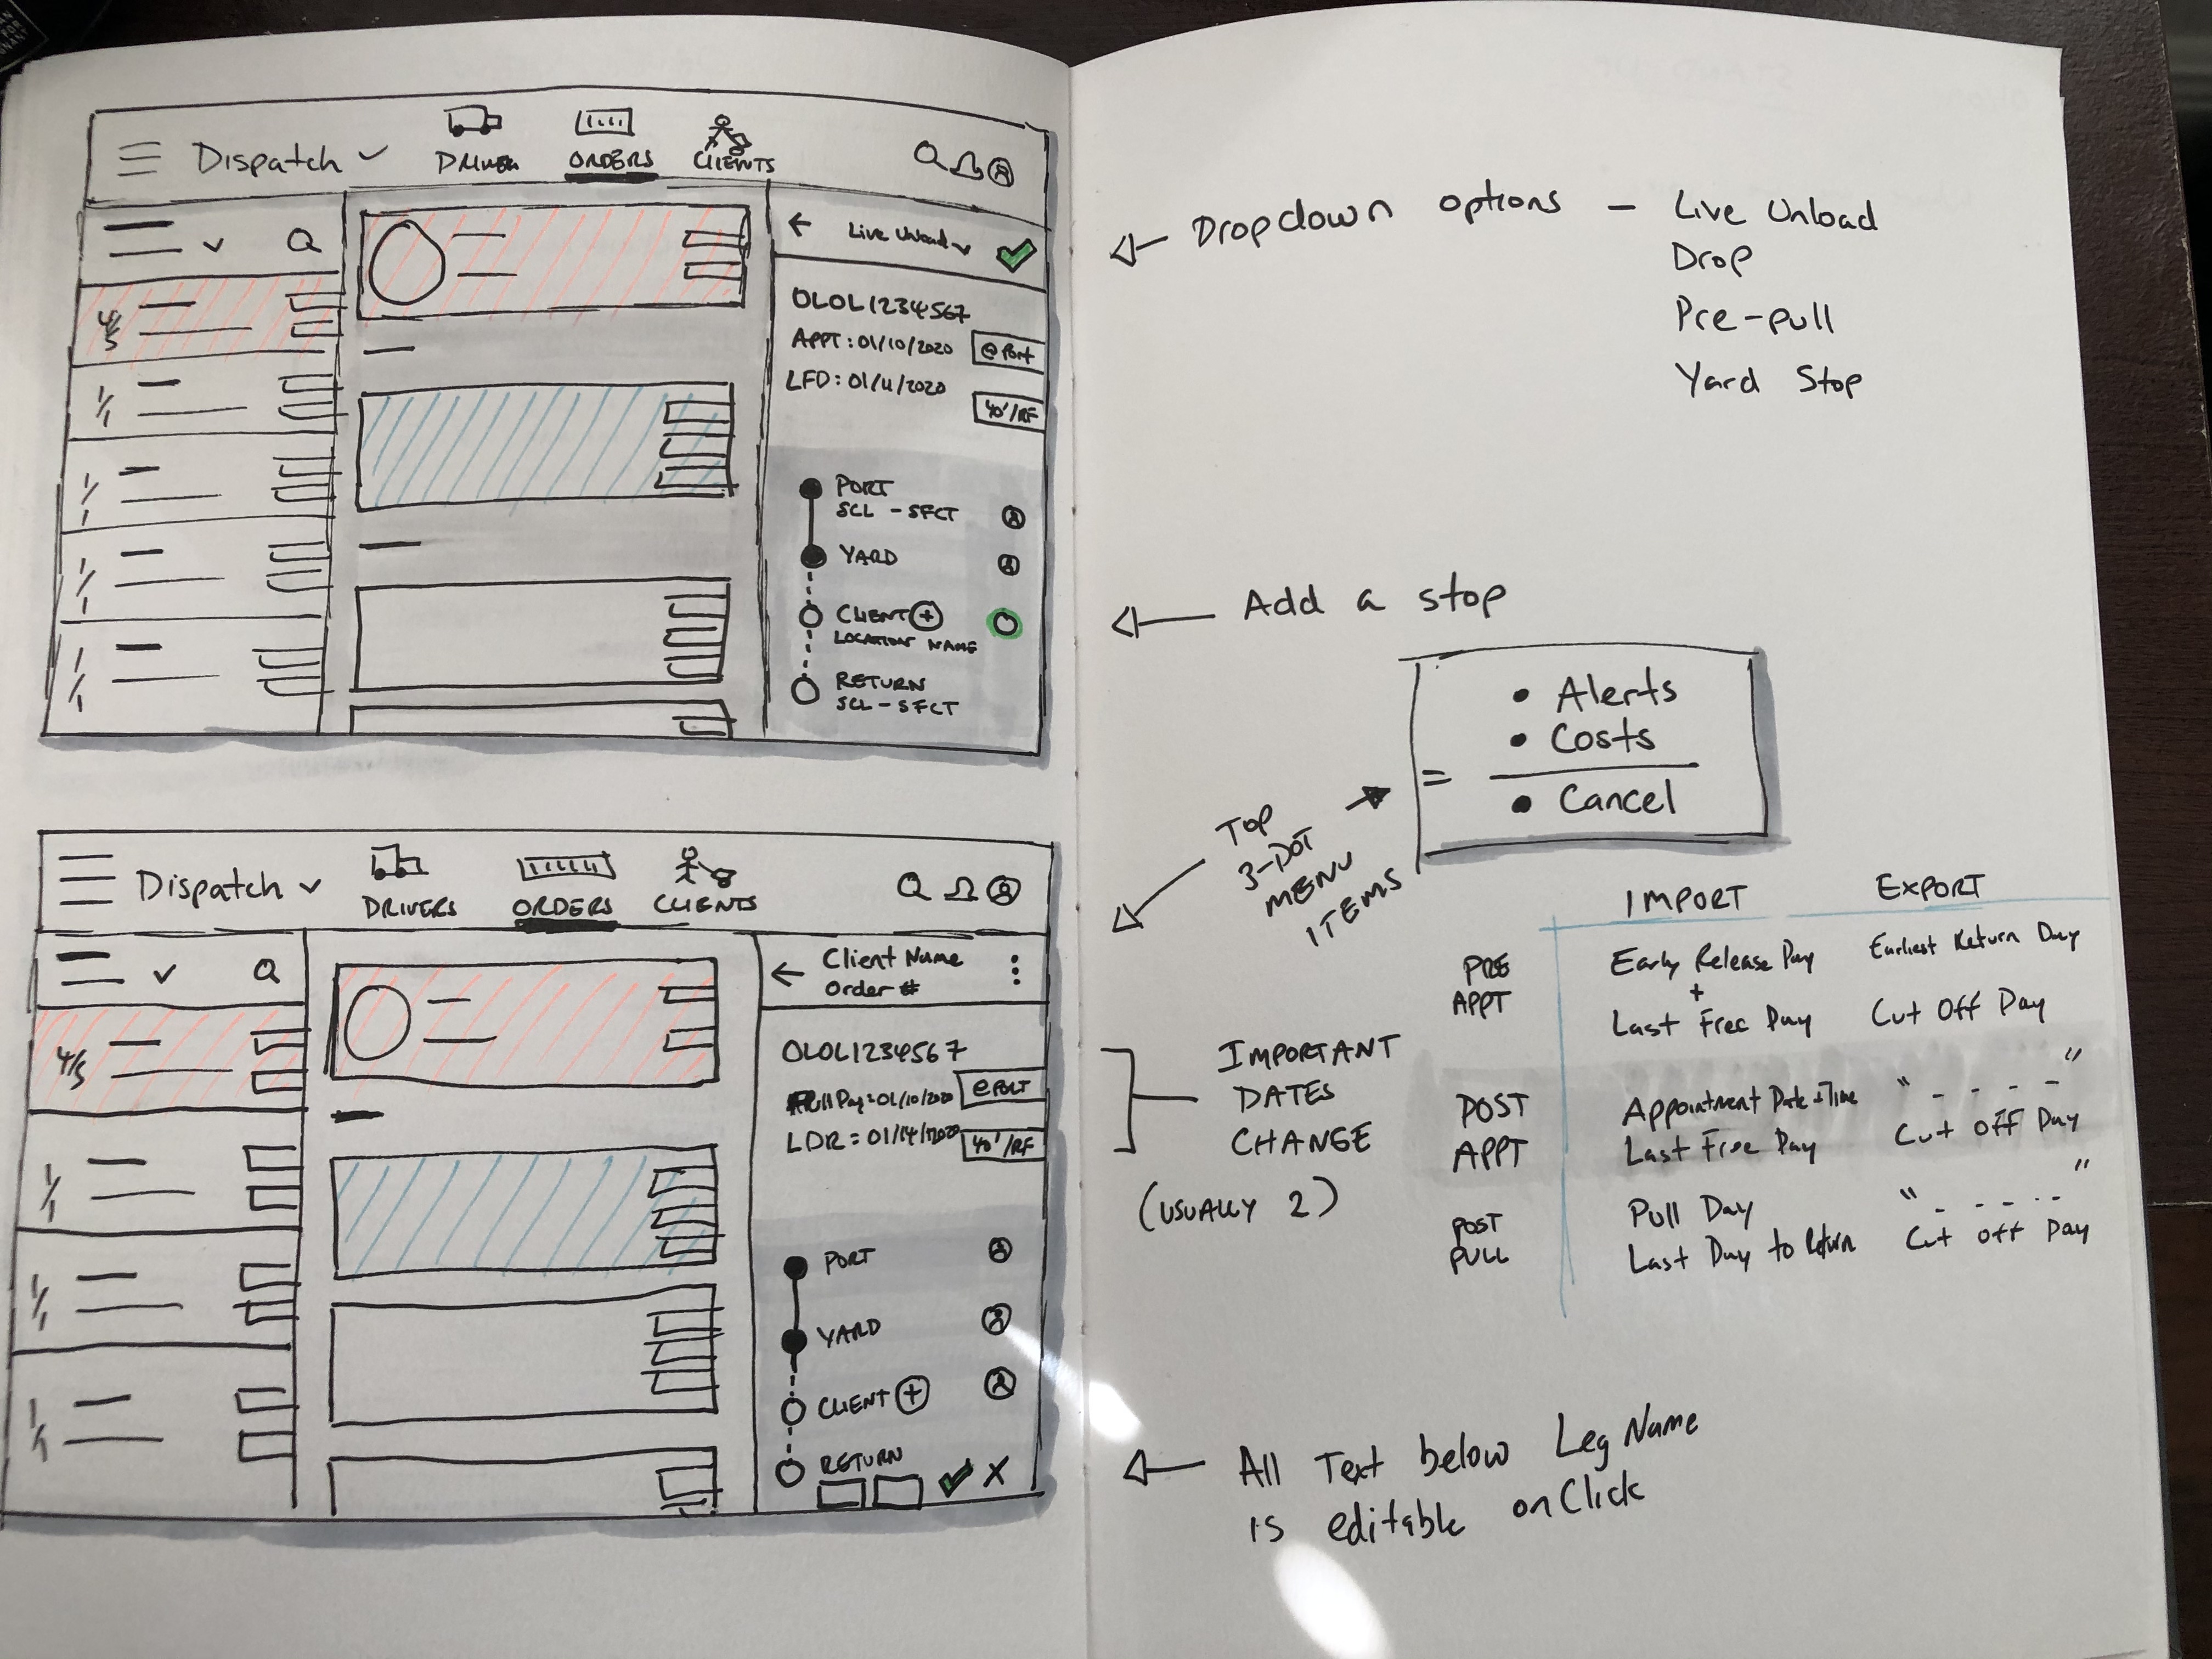
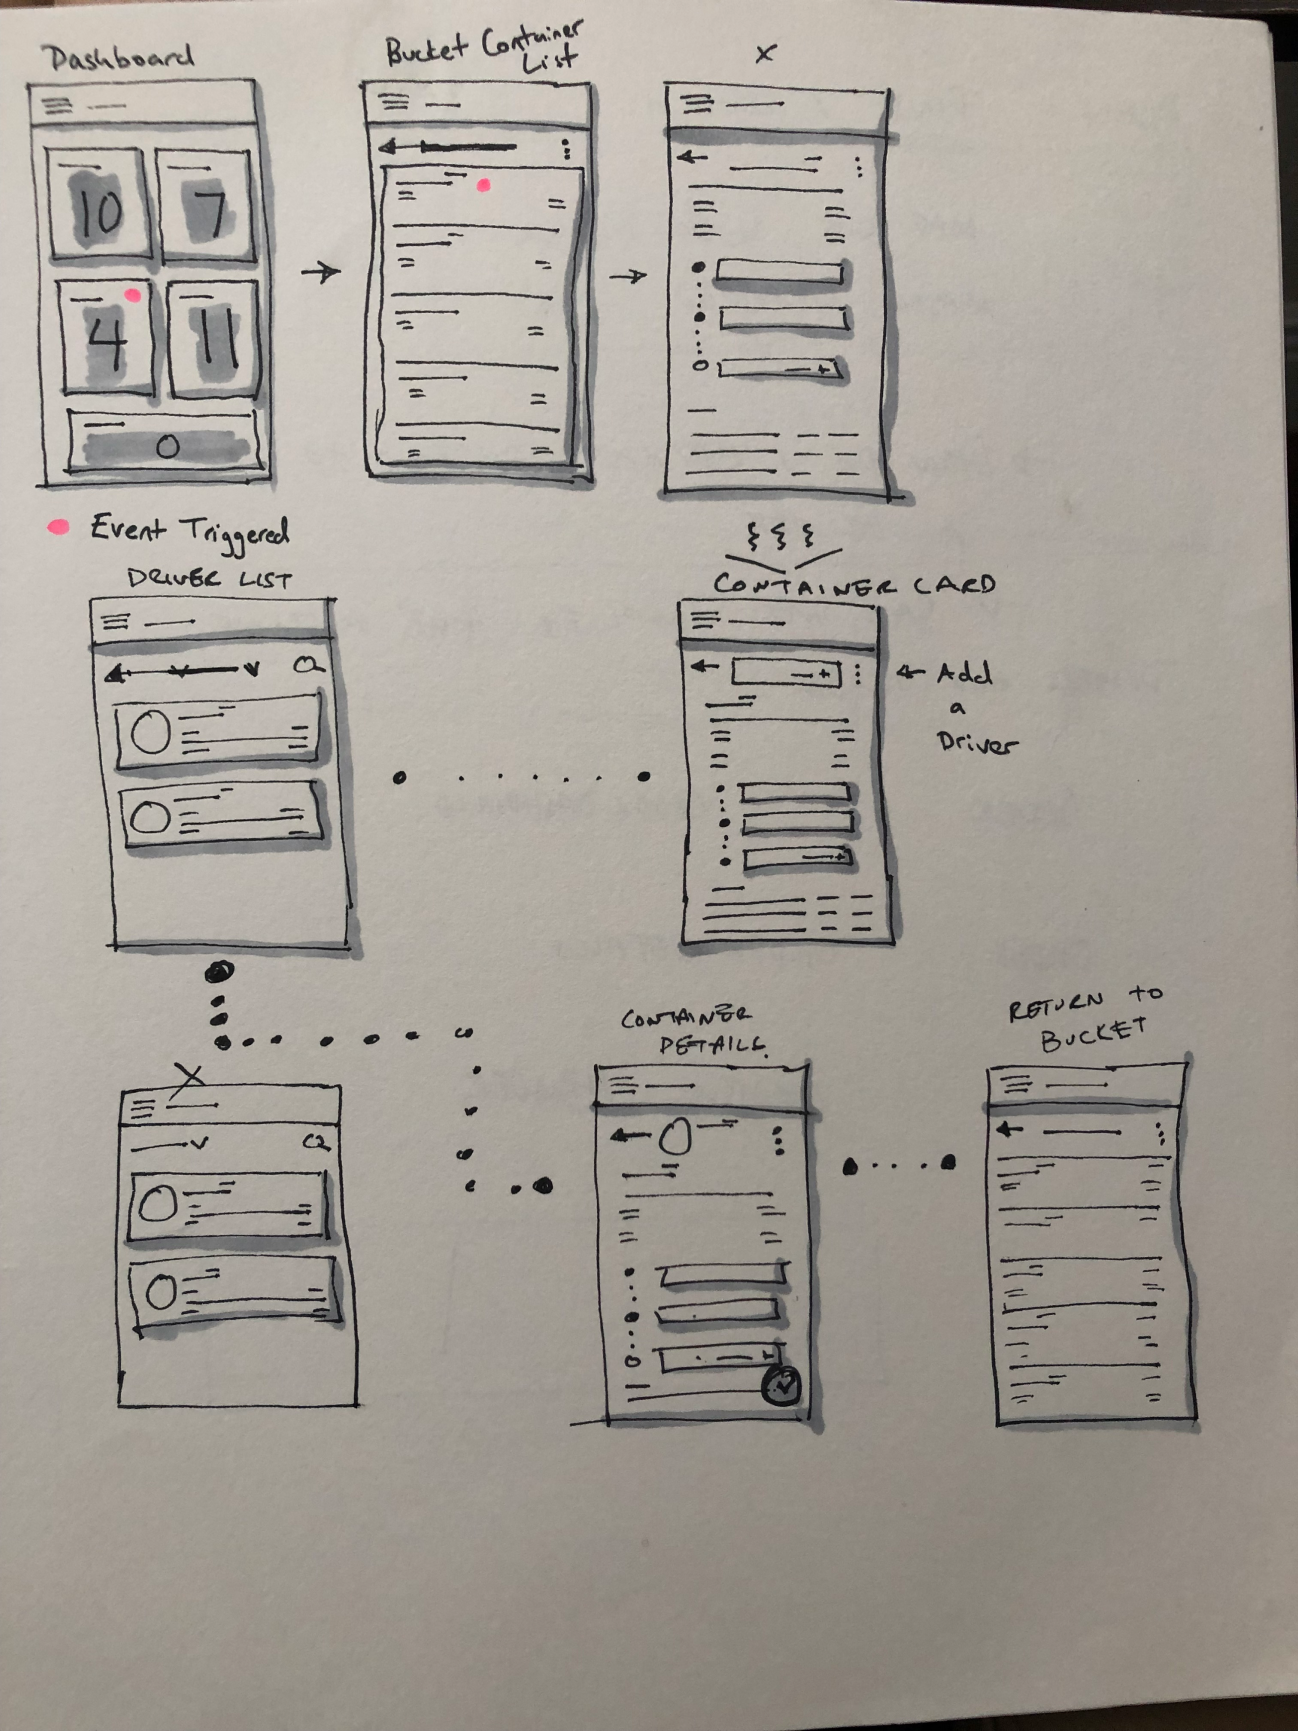
The project leader agreed and asked for user flows to be done. The diagram below shows the user flow for dispatching.
One of the challenges encountered was how to present the right information to the user, without overwhelming them.
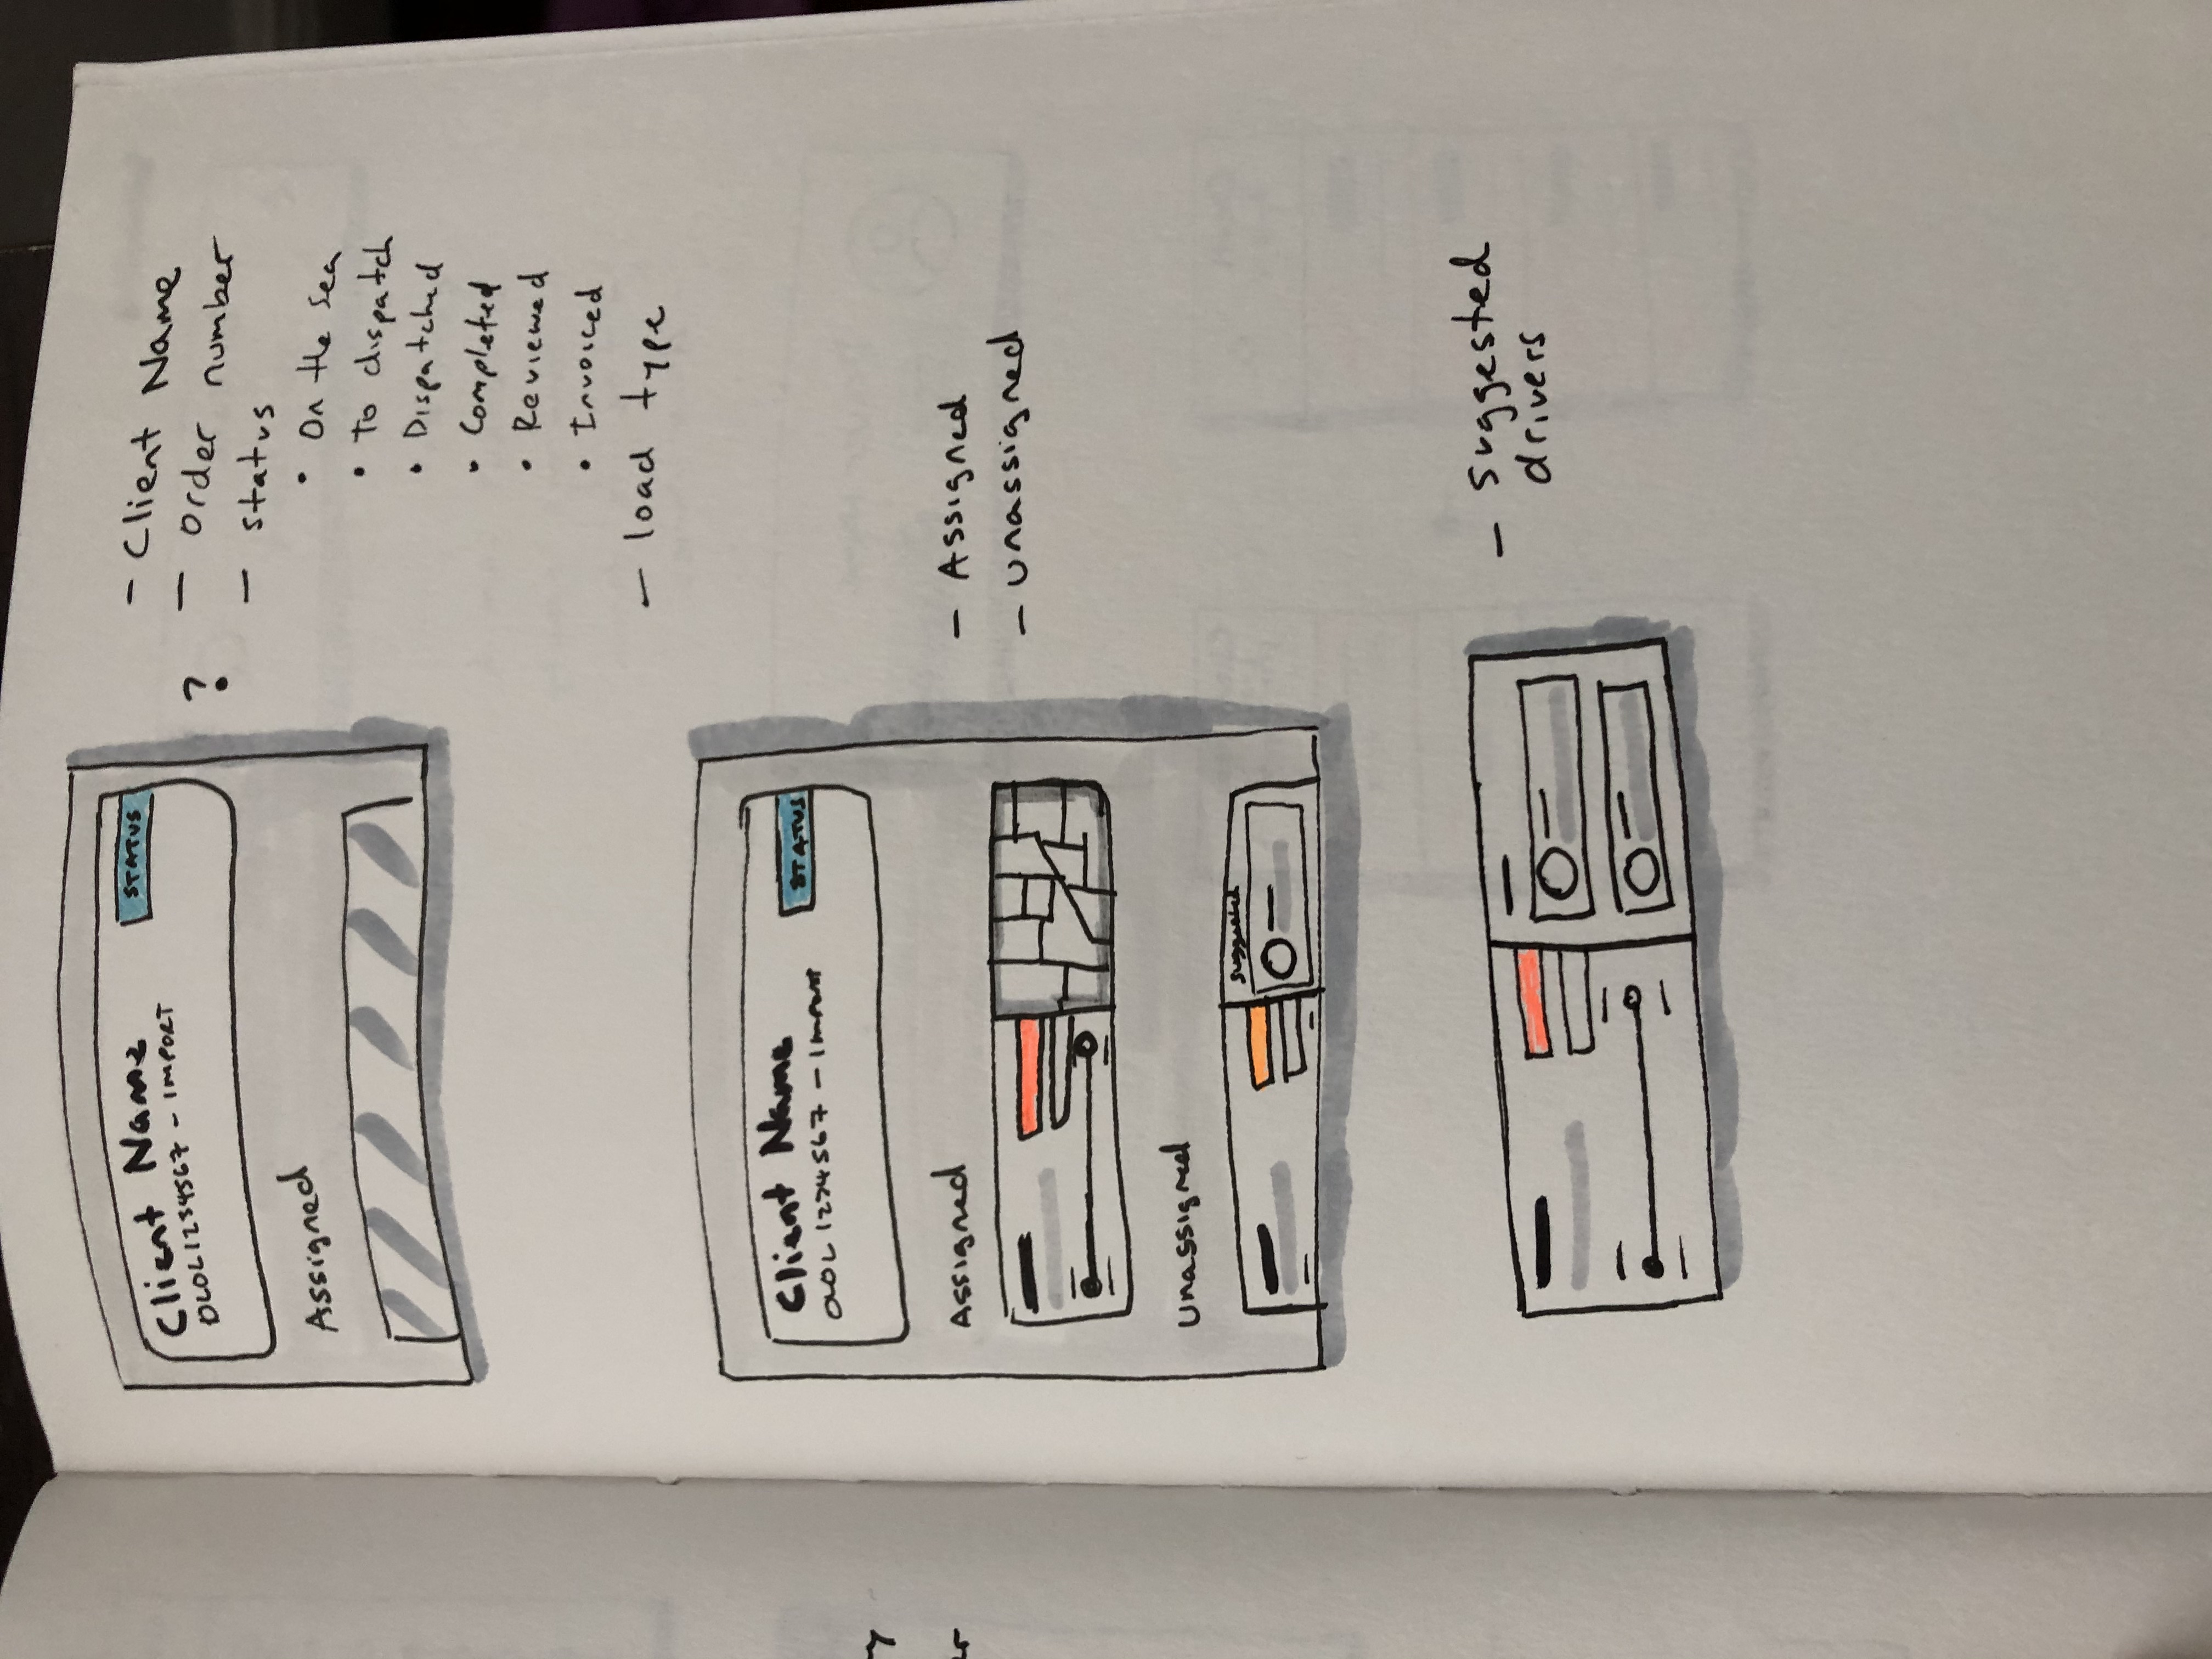
First thing was looking at the container cards and the information they had.
.jpg)
Then using a spreadsheet I looked at what happens to these endpoints in different stages of the container card.

I had to communicate this finding in such a way that it would be easier than a spreadsheet, so I did the following exploration on progressive disclosure.
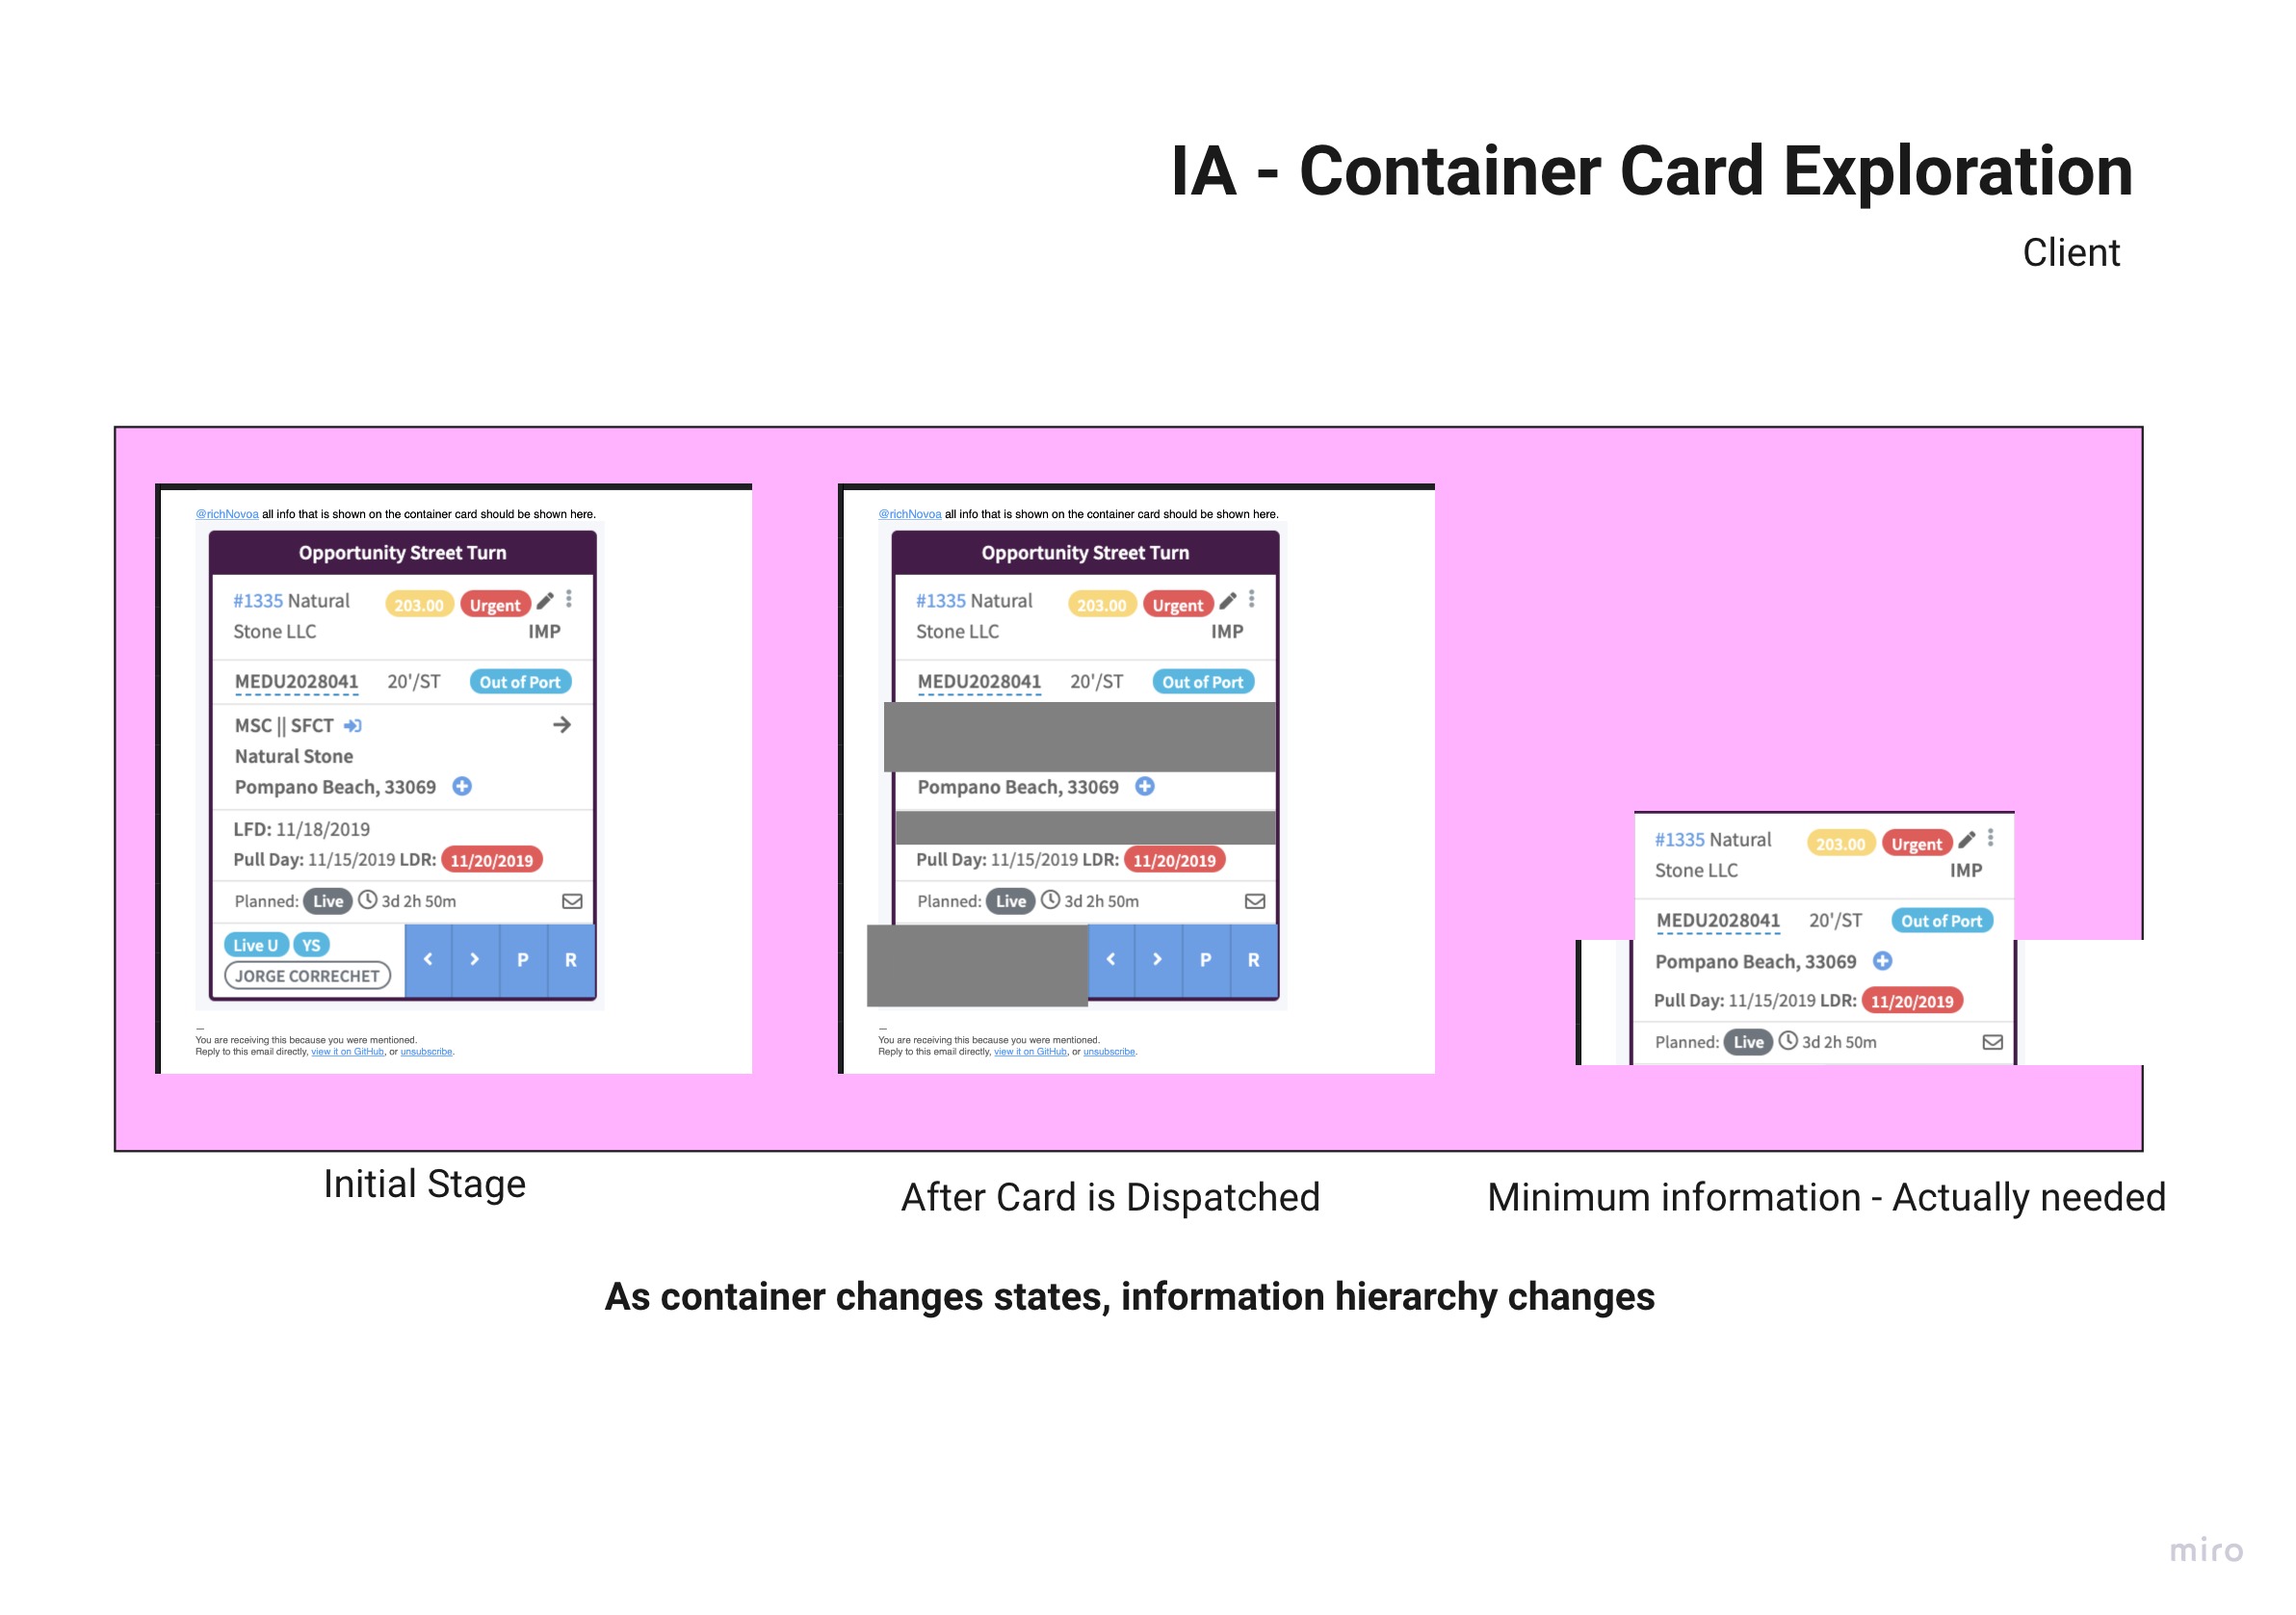
This significantly reduced the size of the cards and the excessive amount of indicators and endpoints for the user.
There was a lot of terms that where used to describe the same things to different people on the team. In fact some where used interchangeably yet actually meant different things on the client side than what was going on in the back-end. To further this issue, the team was implementing graphQL to speed up the response to API and allow flexibility for later changes, while reducing the number of calls to outside servers.
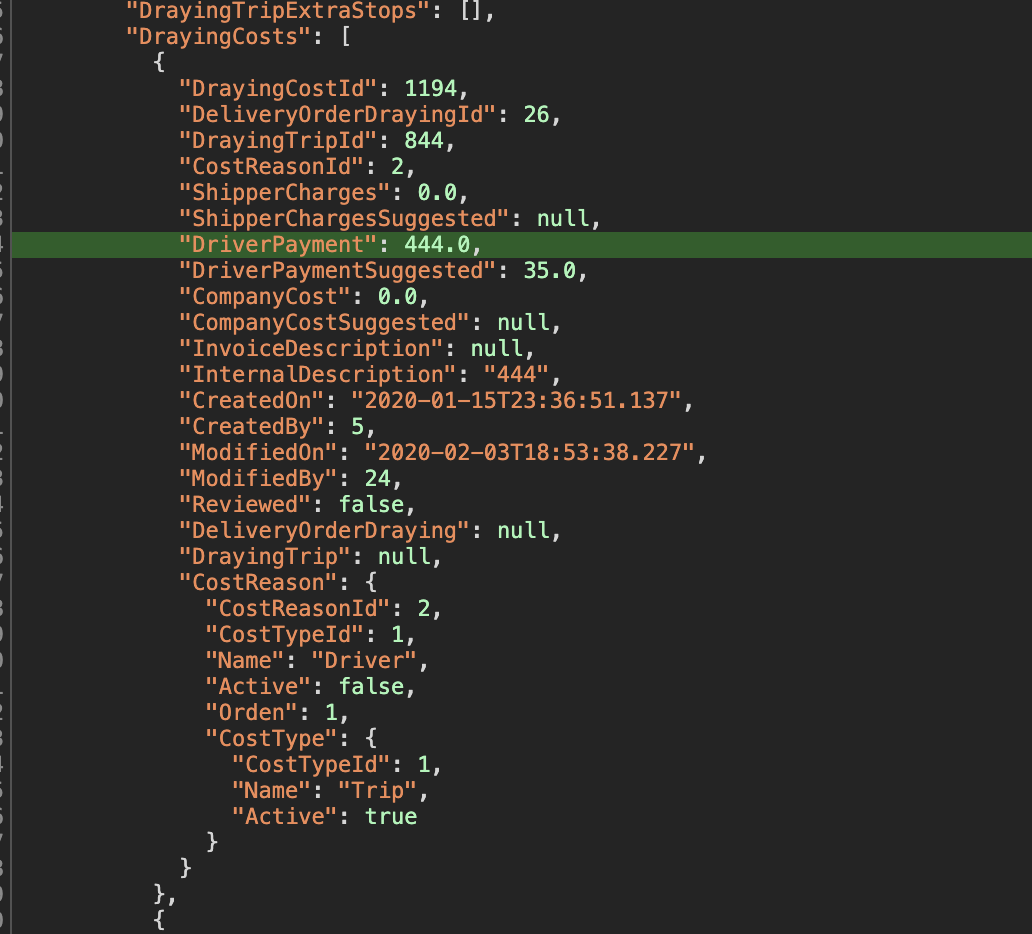
Heres an example of what the labels on endpoints communicated on the user facing side.
Yet with a little peek through the DOM, the naming conventions in the back-end where slightly different.
Sometimes a quick sketch could clarify this:
.jpg)
In the end it took meetings with stakeholders and developers to agree on a common nomenclature.
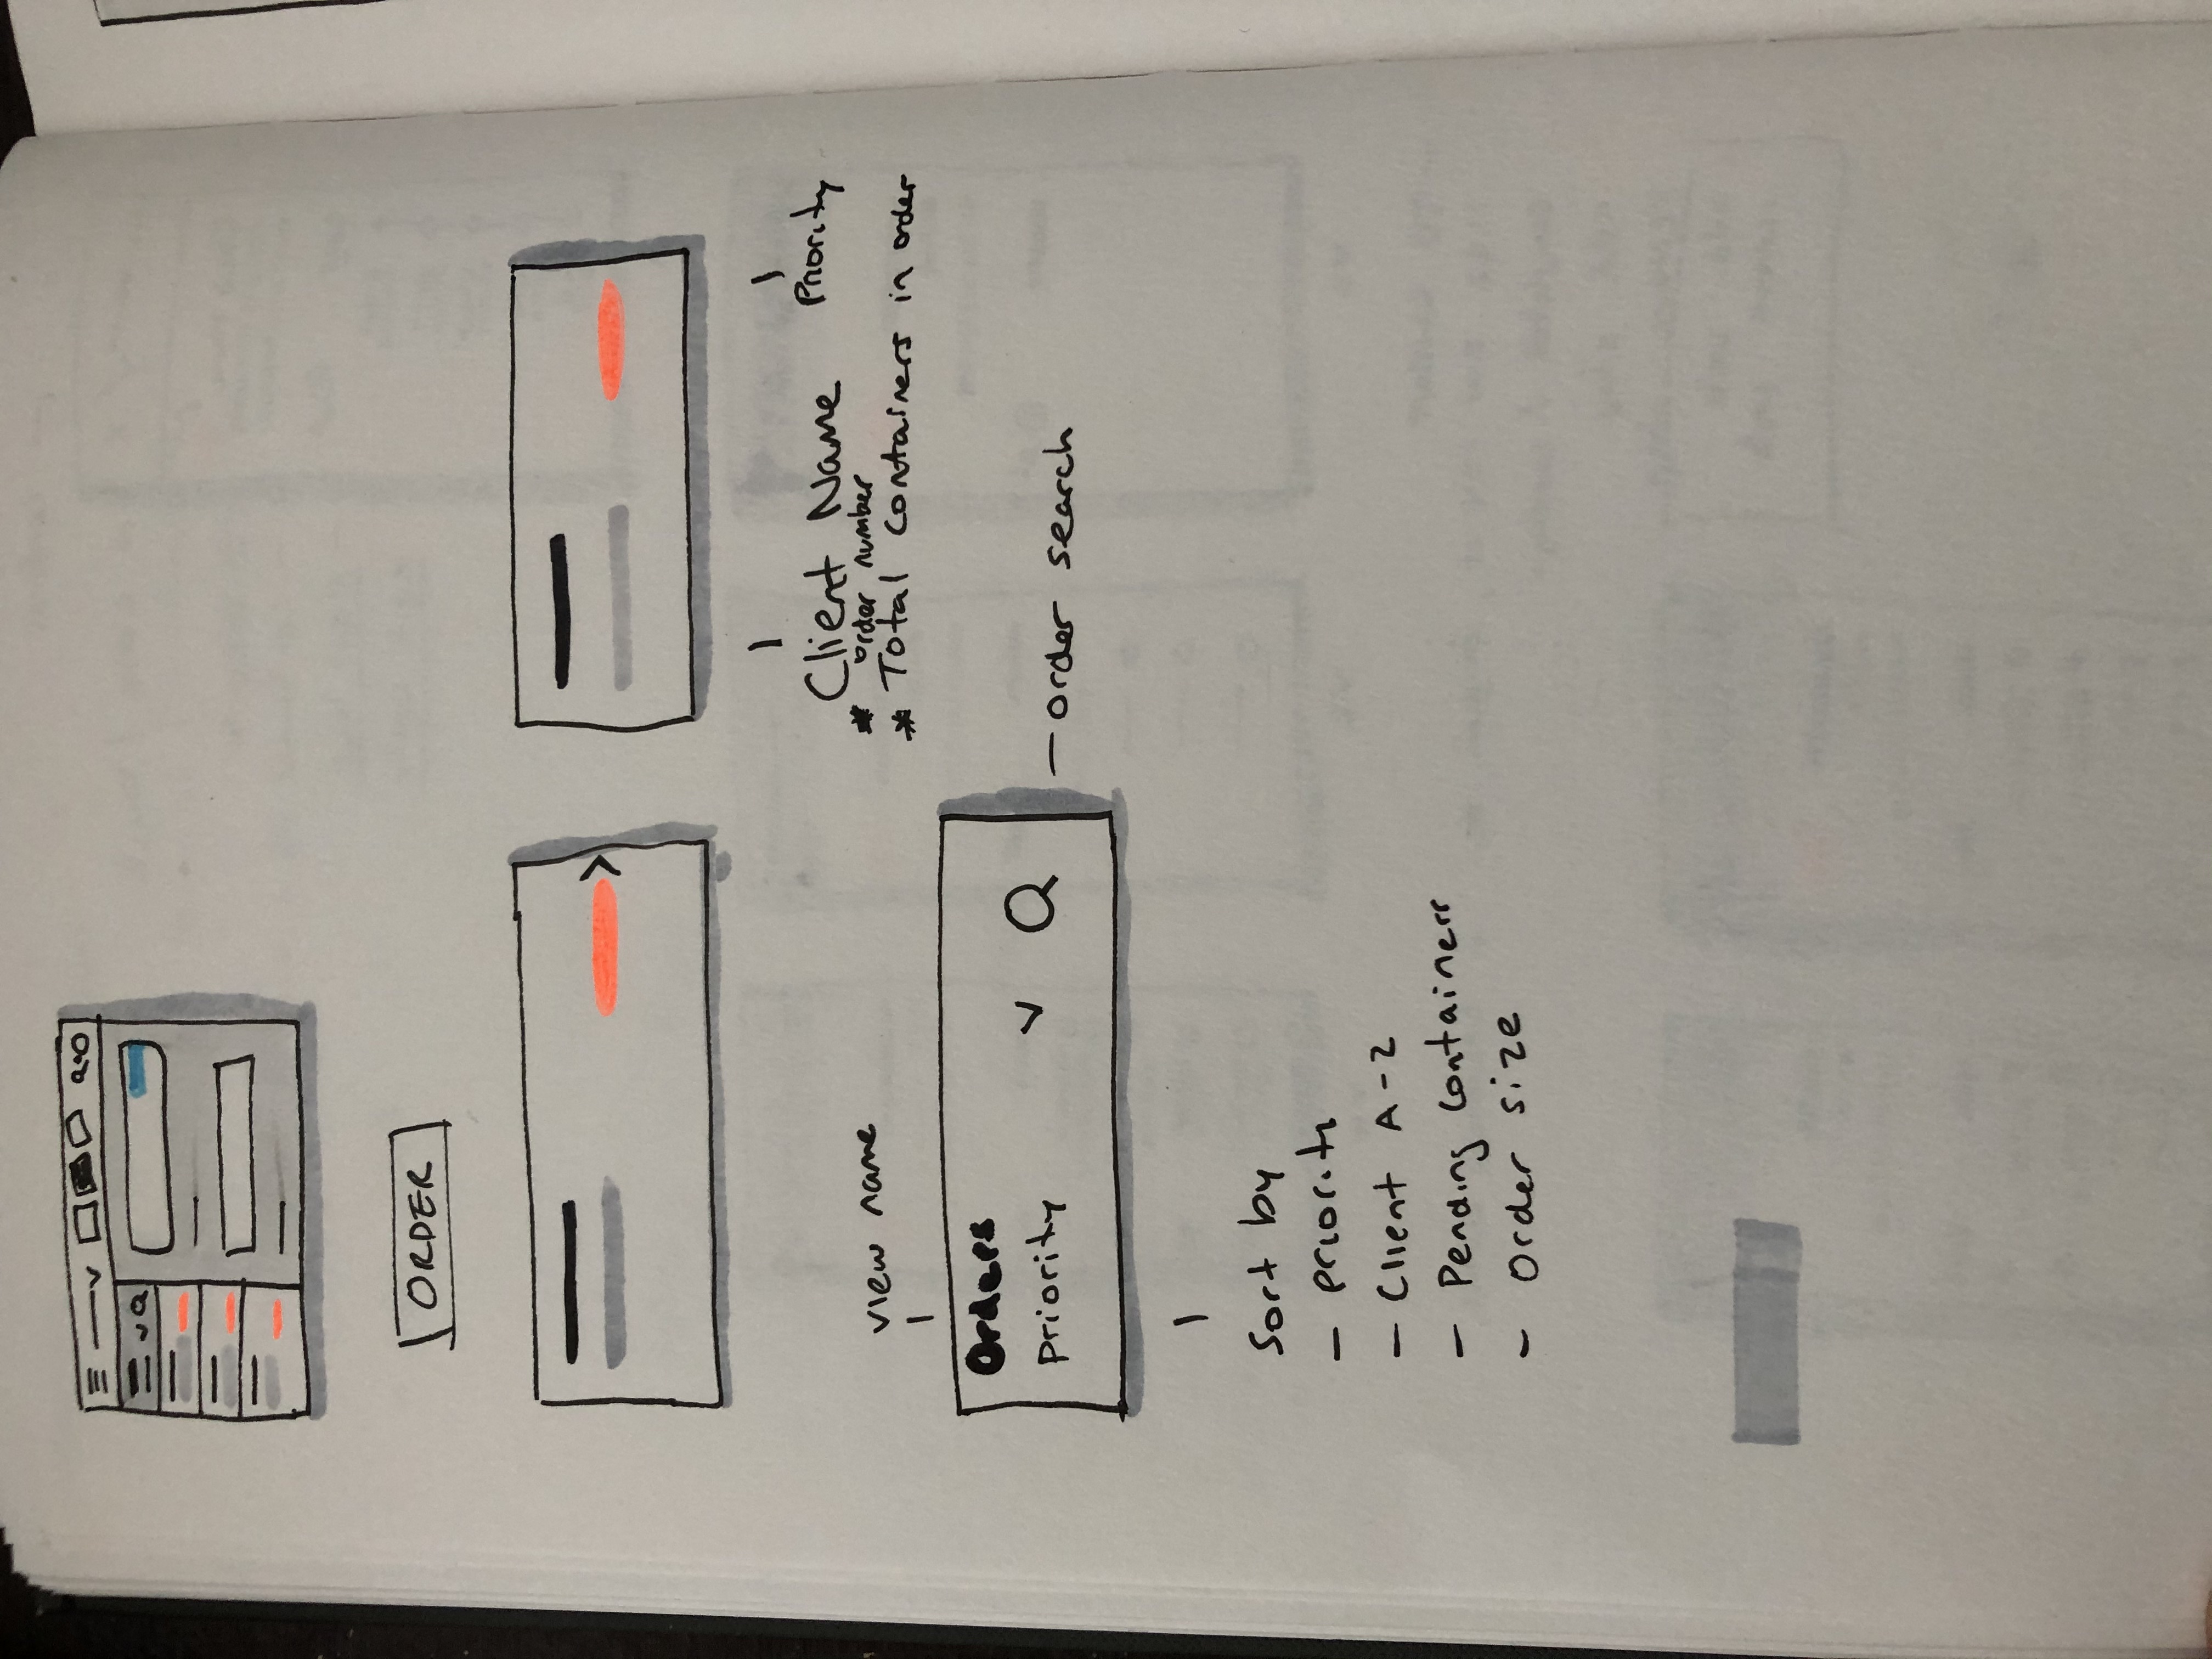
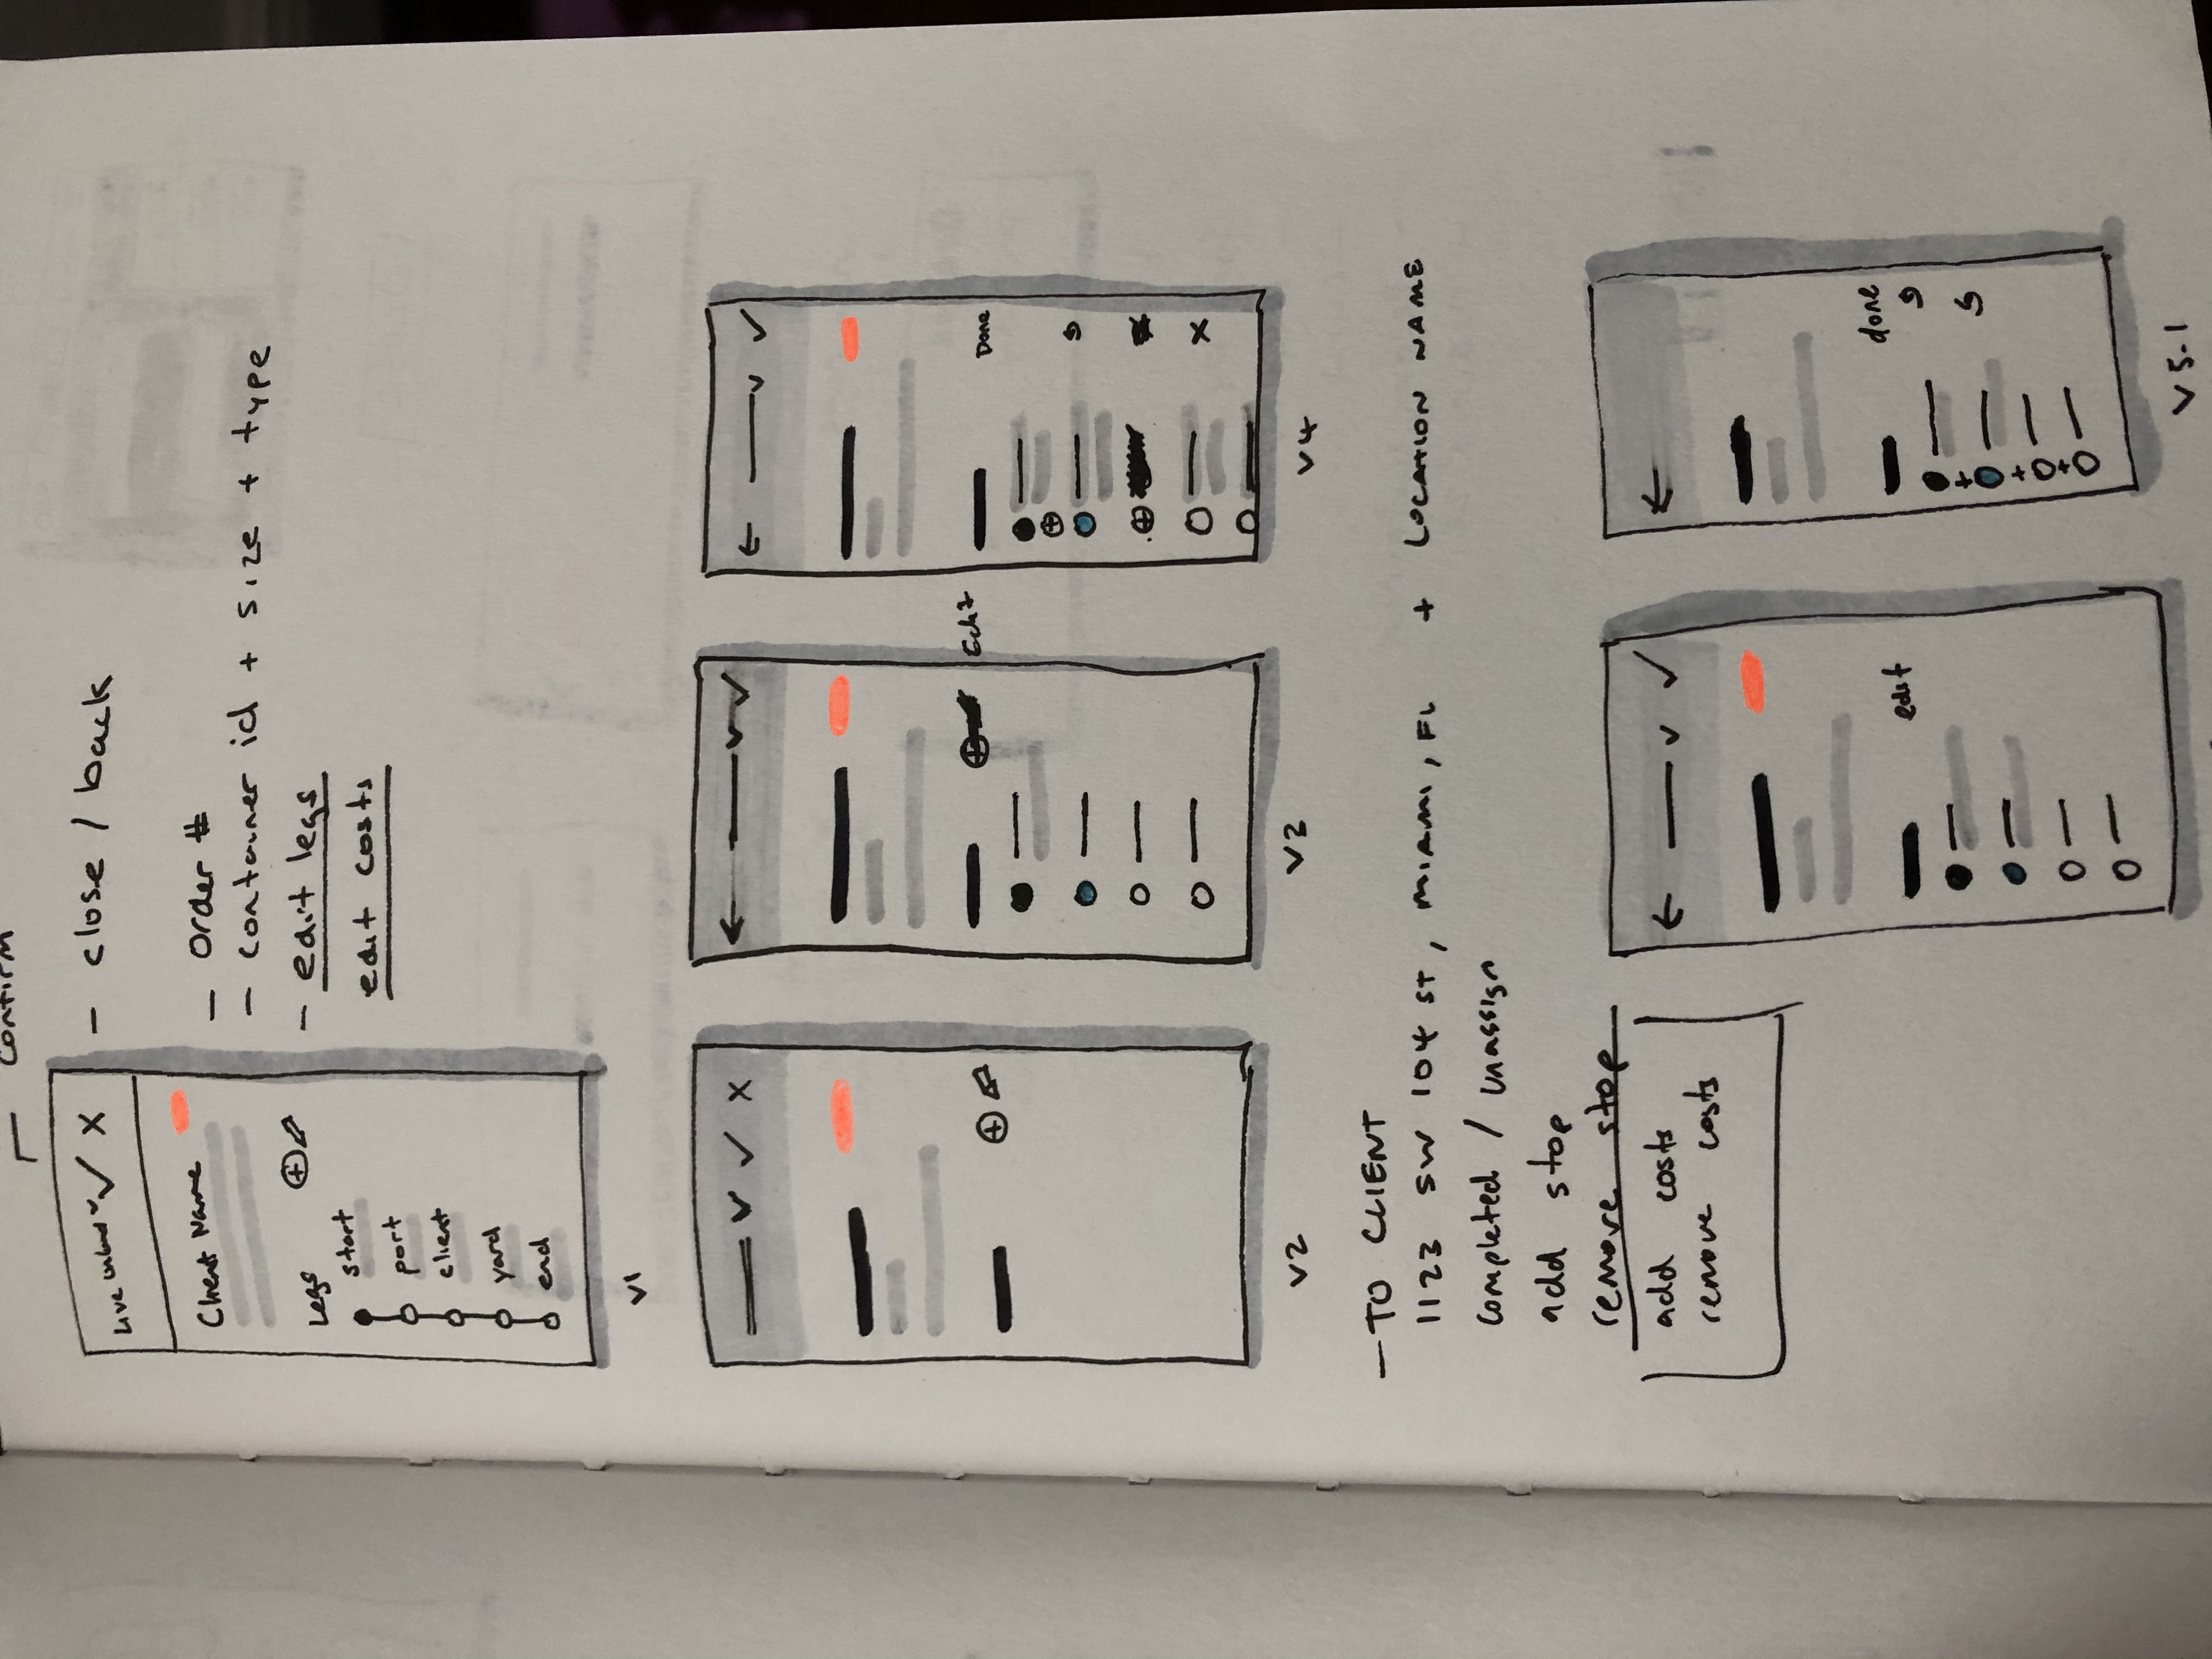
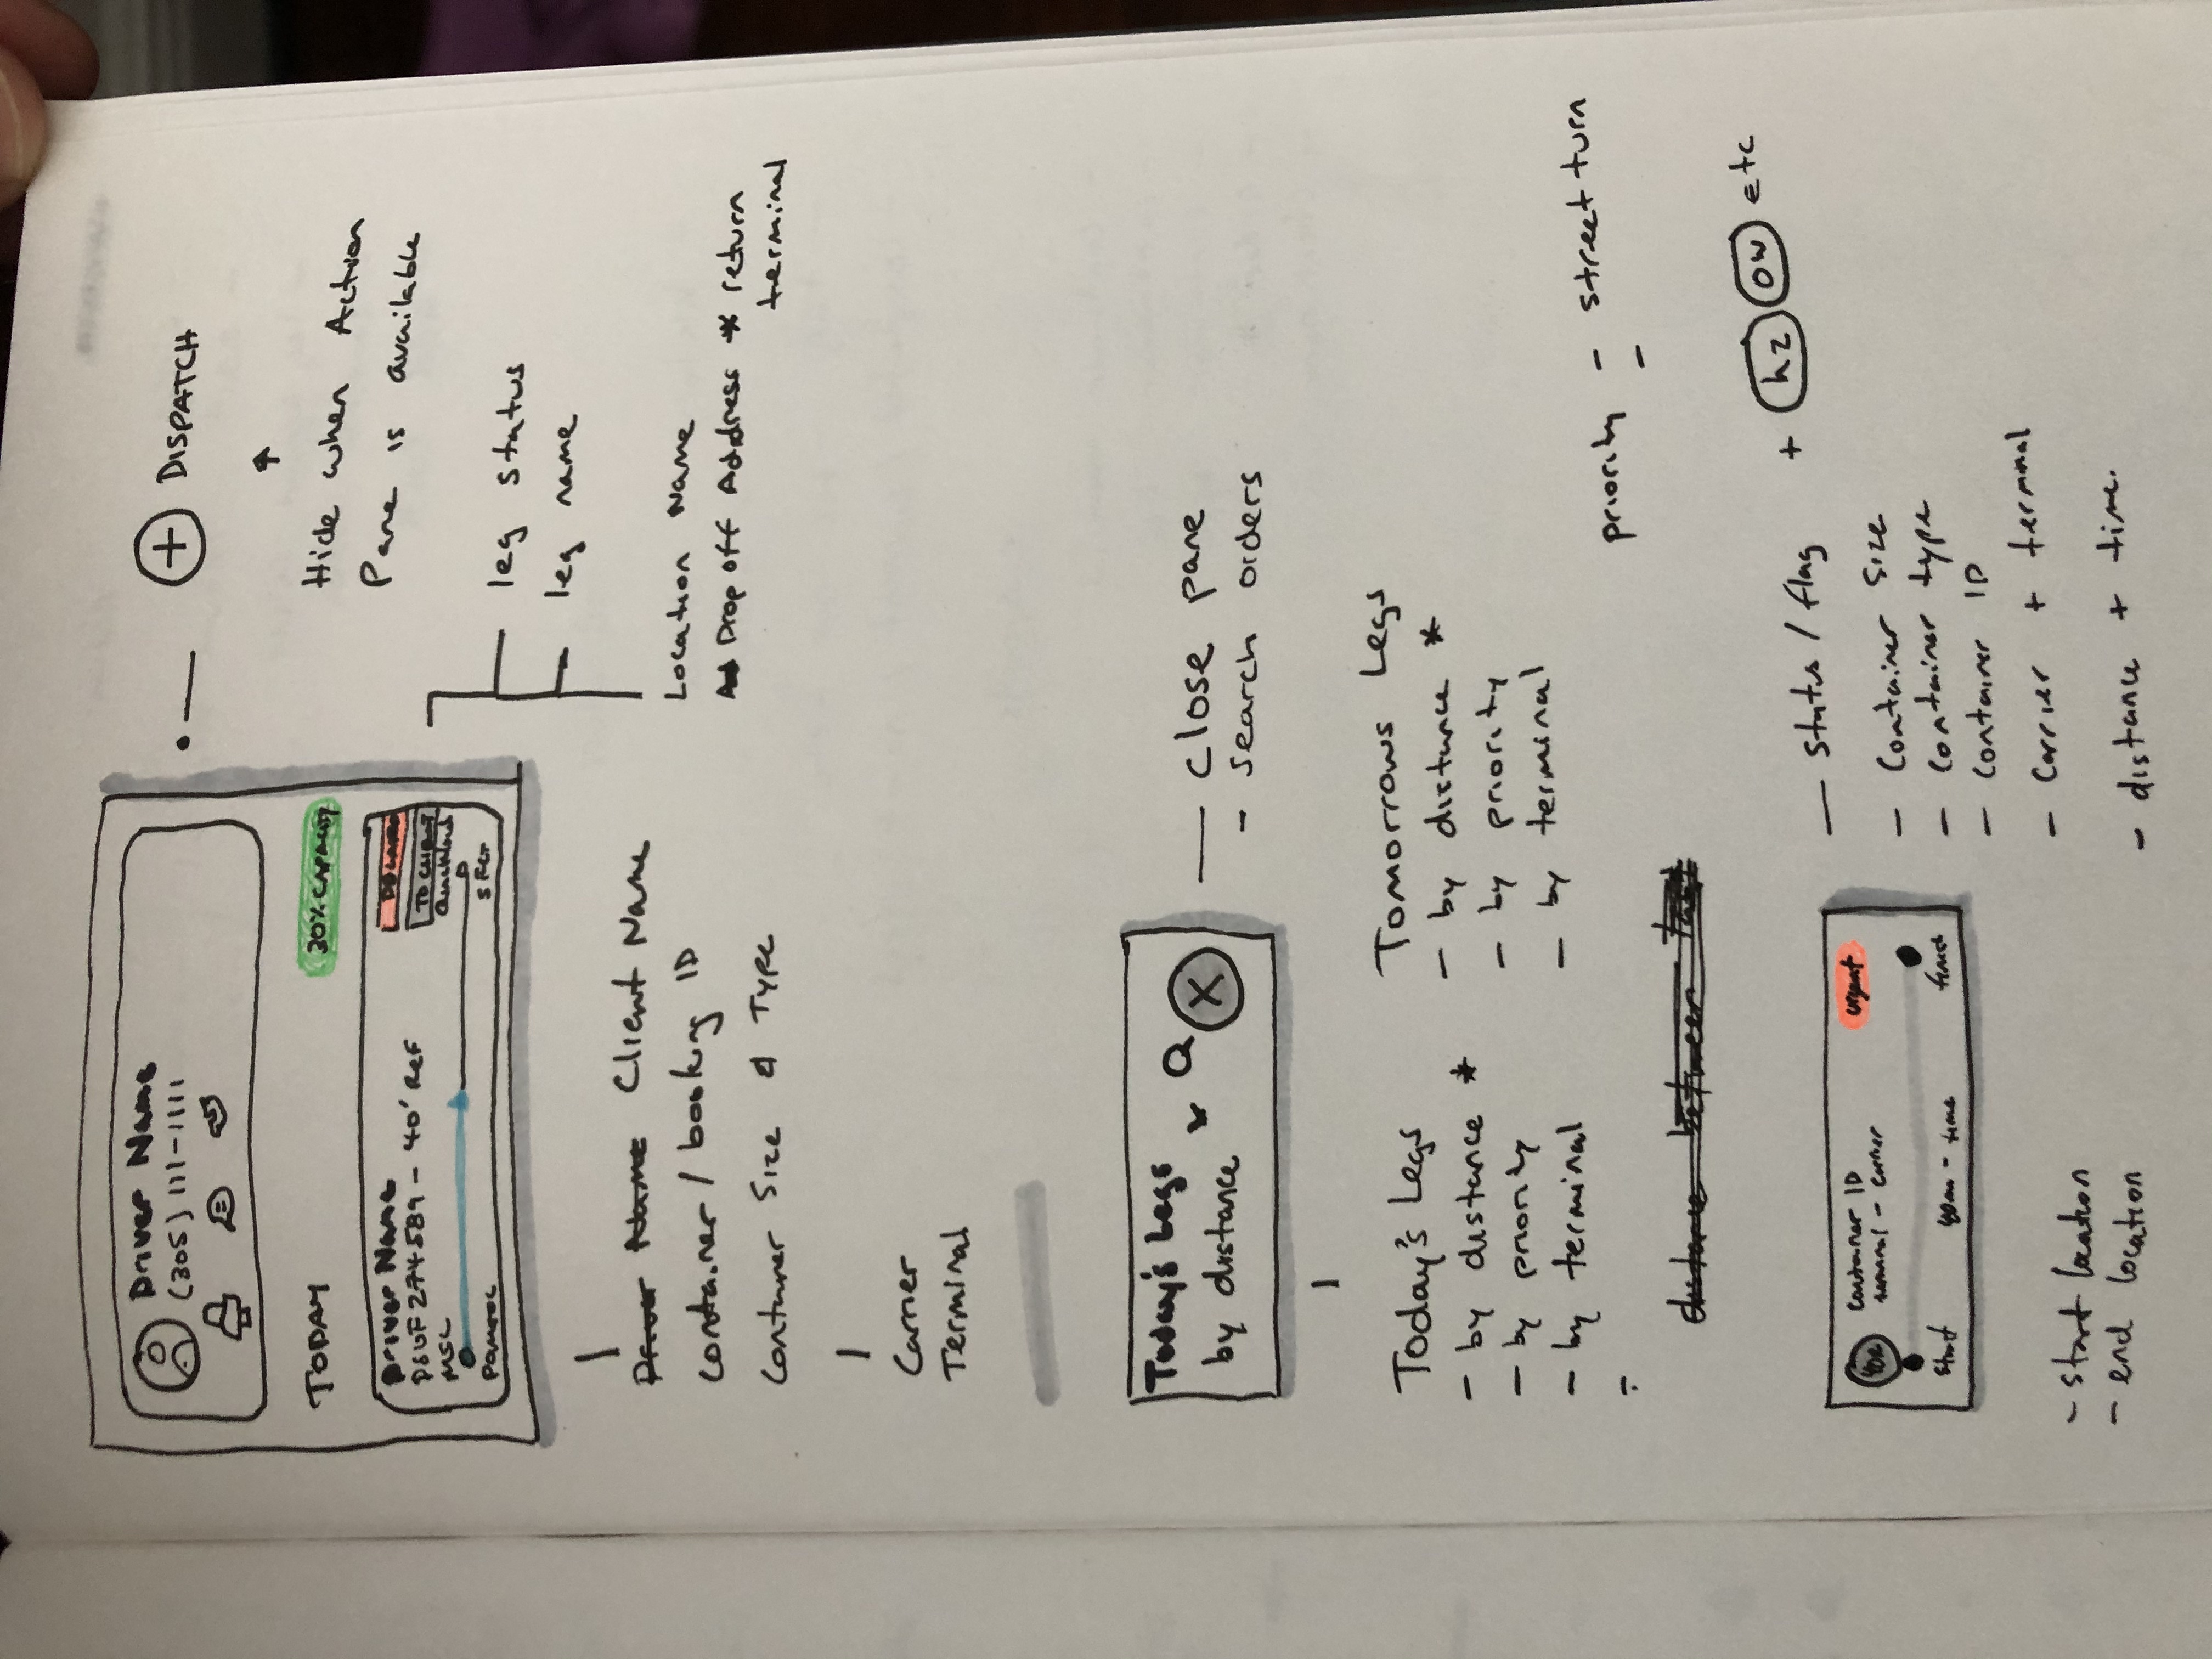
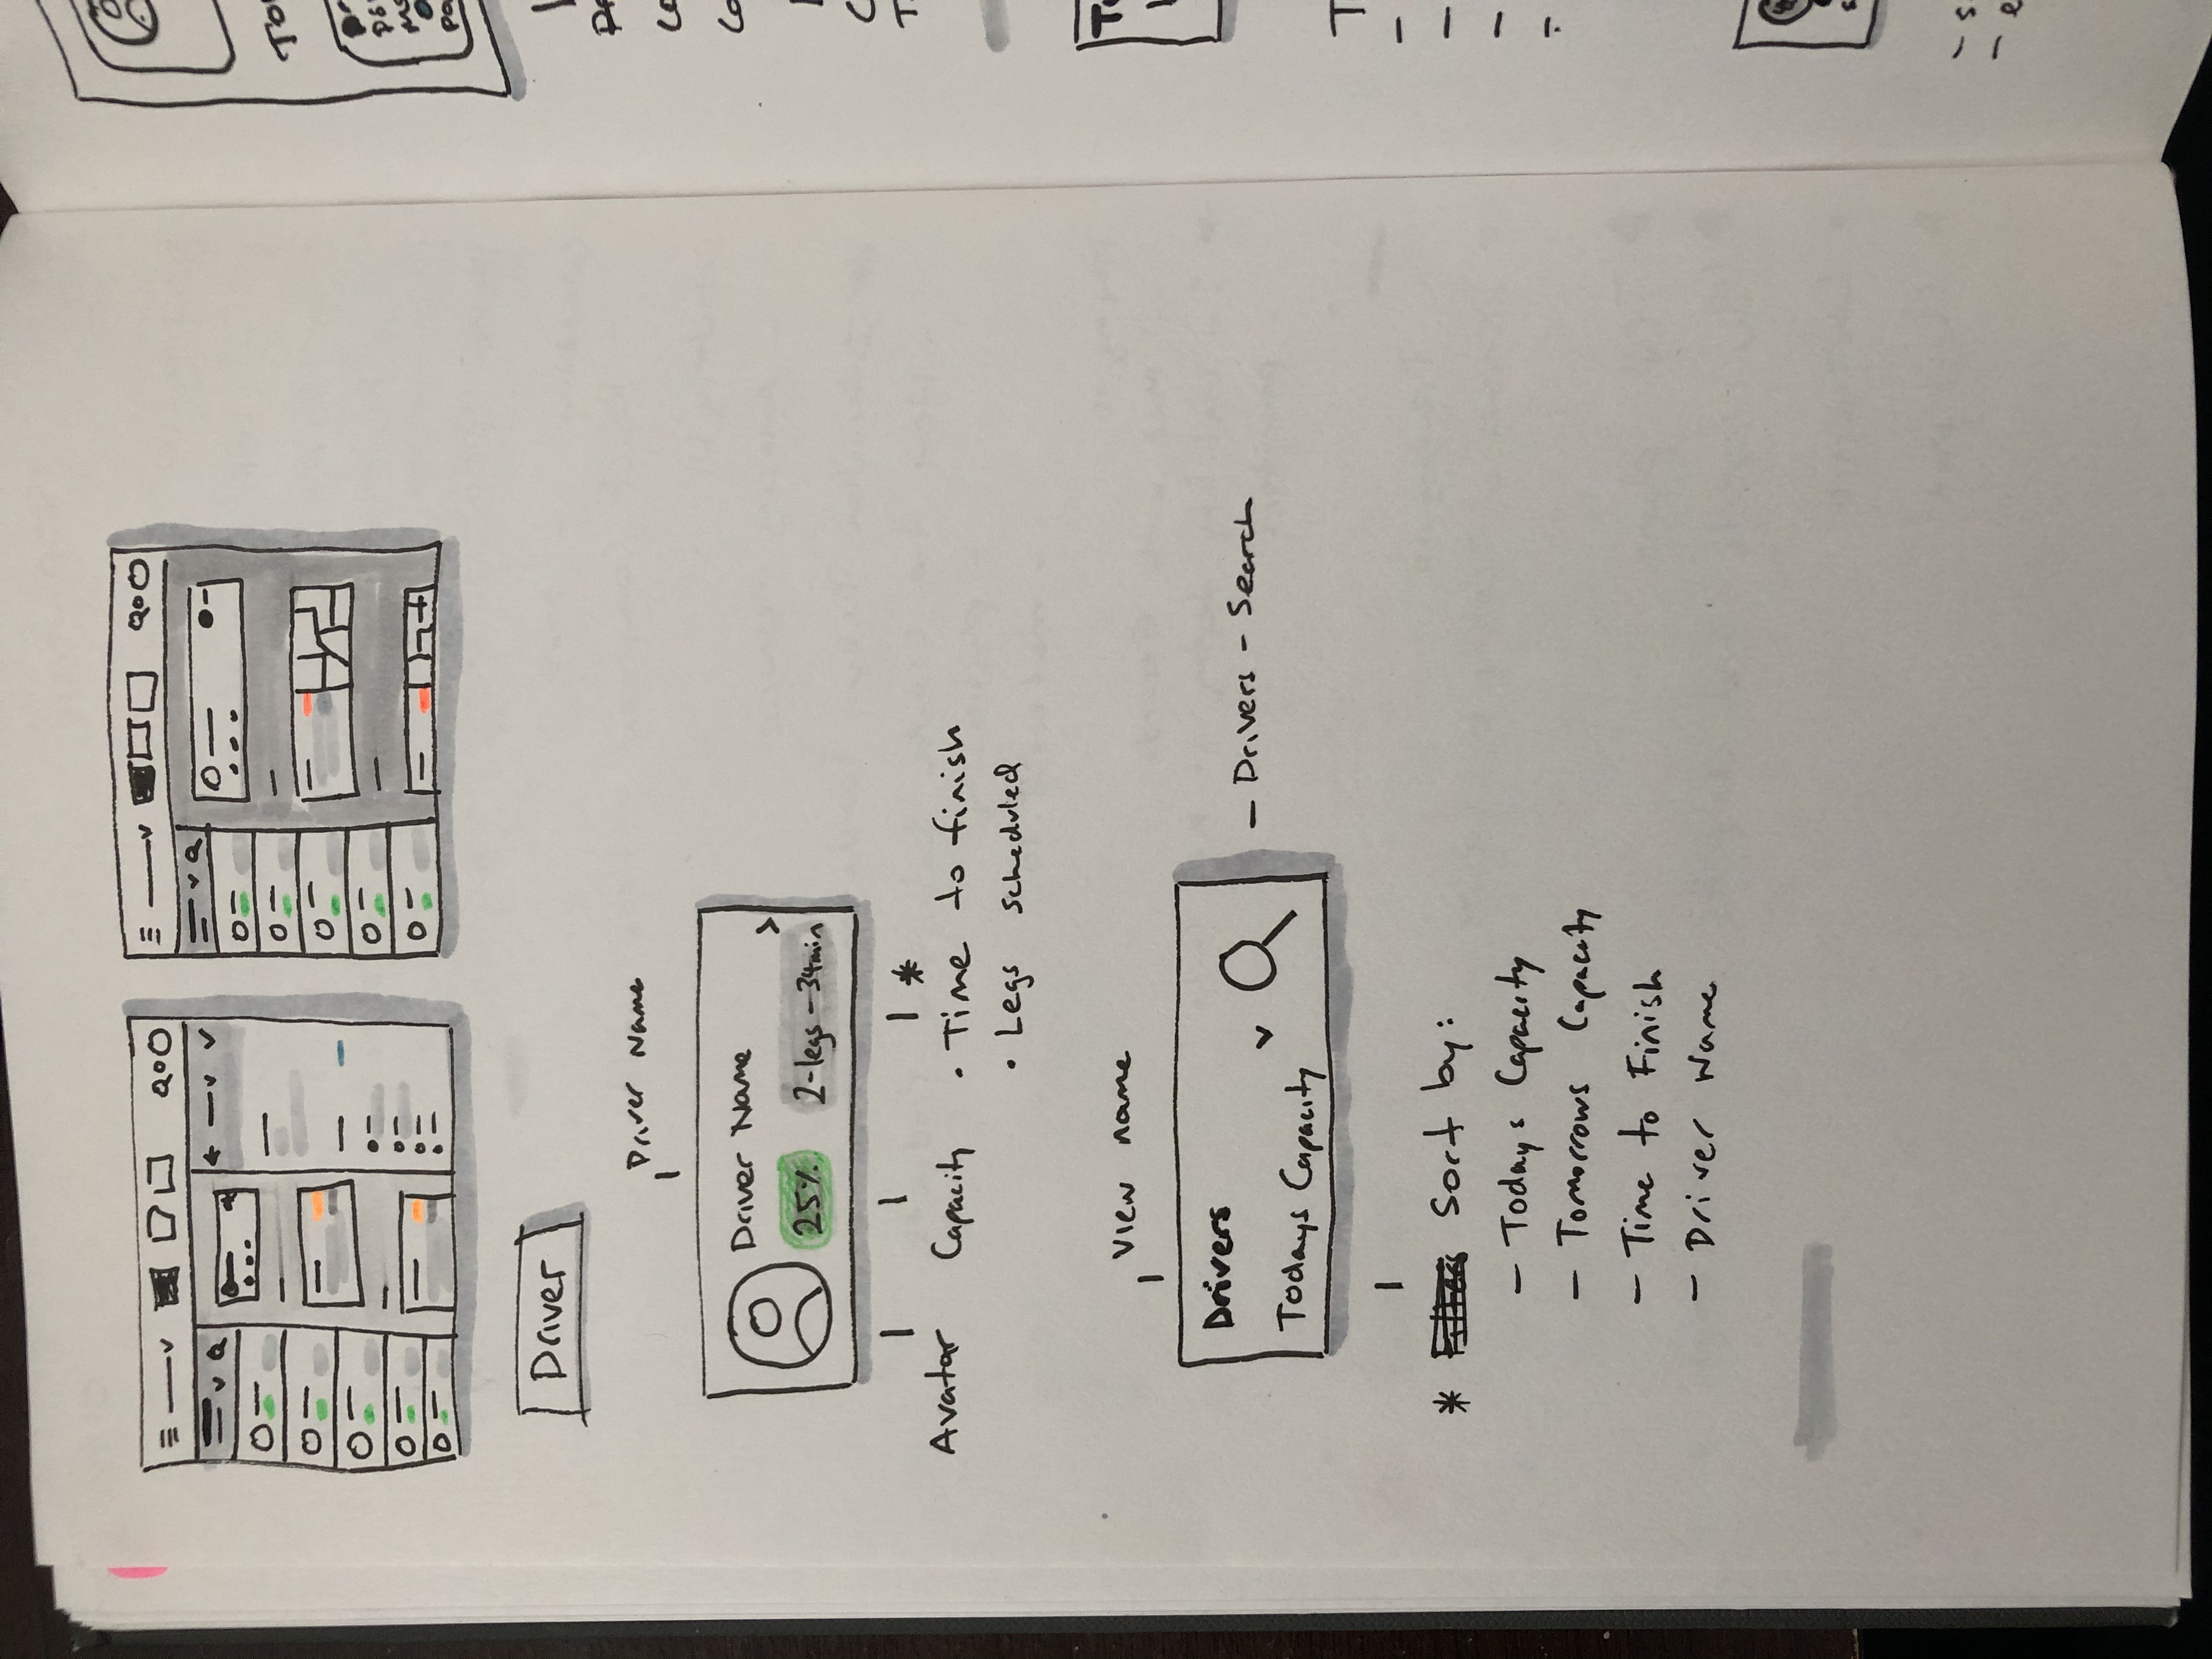
The toughest challenge was bringing together all the work onto a practical screen, with a tight deadline coming up. I had post-it notes all over my workspace.
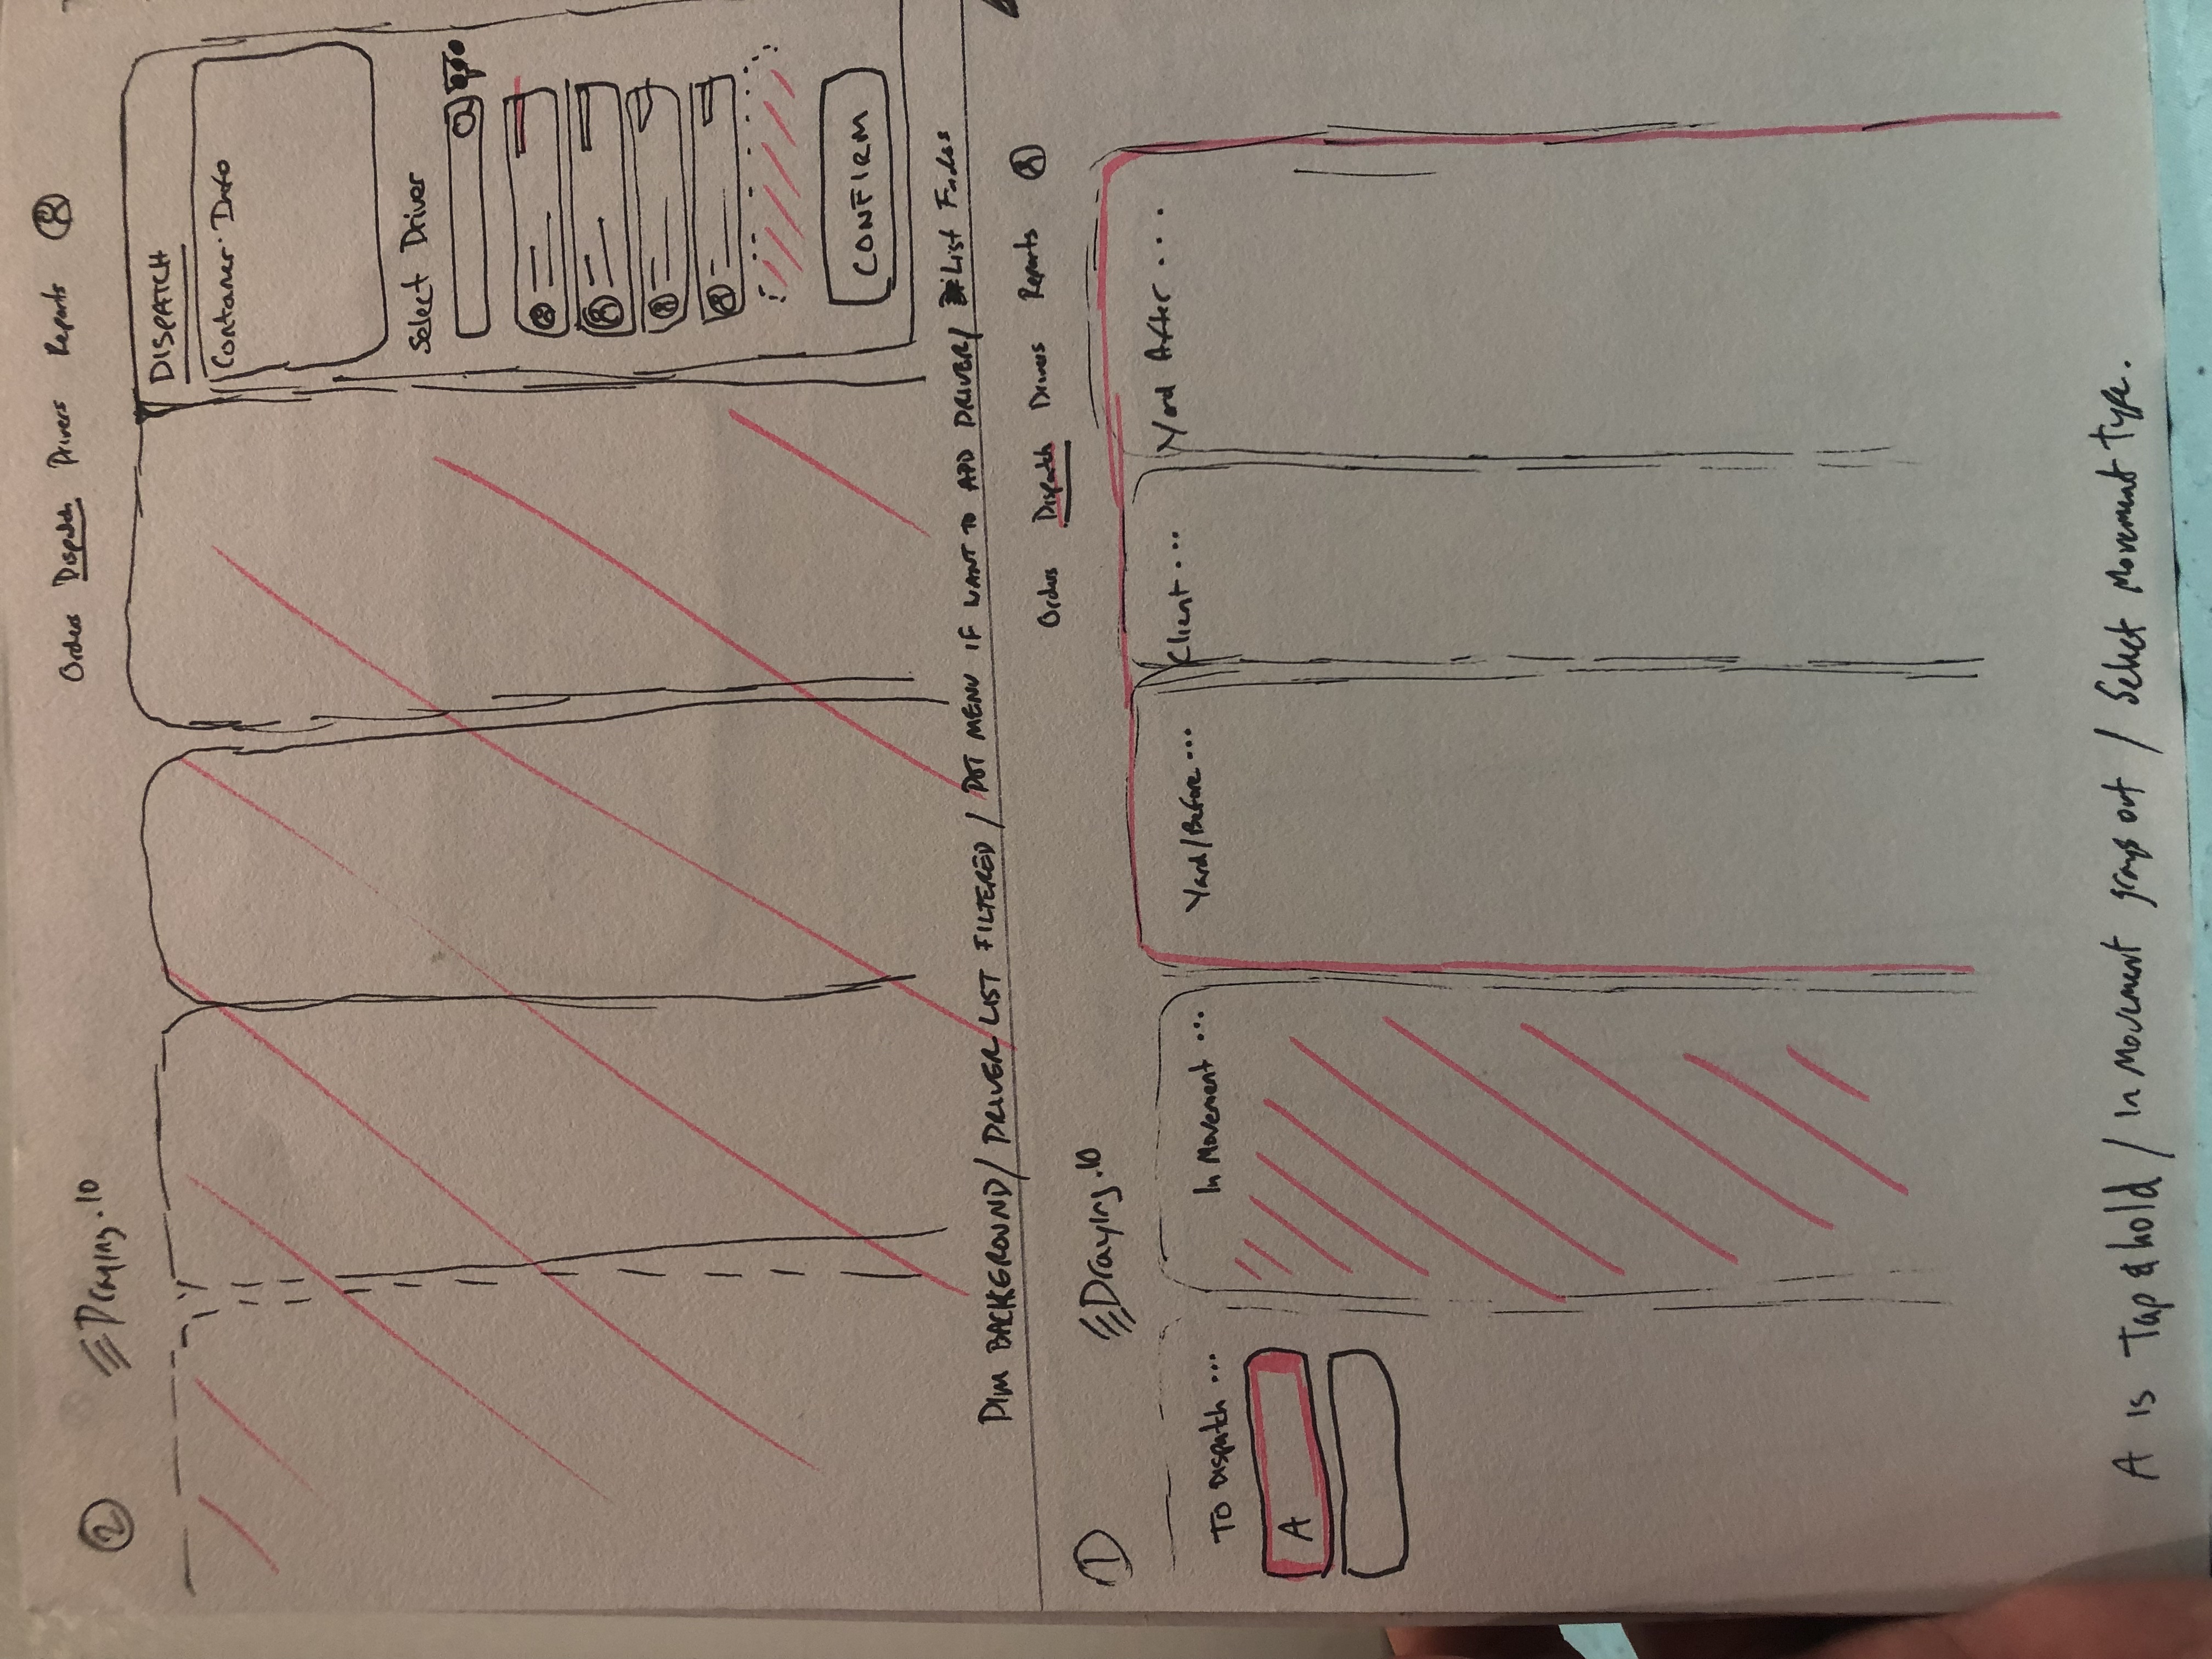
My sketching skill was really bad, yet the panel on the top right was a close approximation of merging the two screens. At this point it looks like a side tab on top of the same kanban view. (yuck). I also have to make sure to include all the endpoints in each component, to get an idea of how to lay it out.

The project leader, took me aside and gave me some tips on communicating sketches a lot better.


It was time to present to the client, the vision of where the design of the app could go.
From here:
To here:

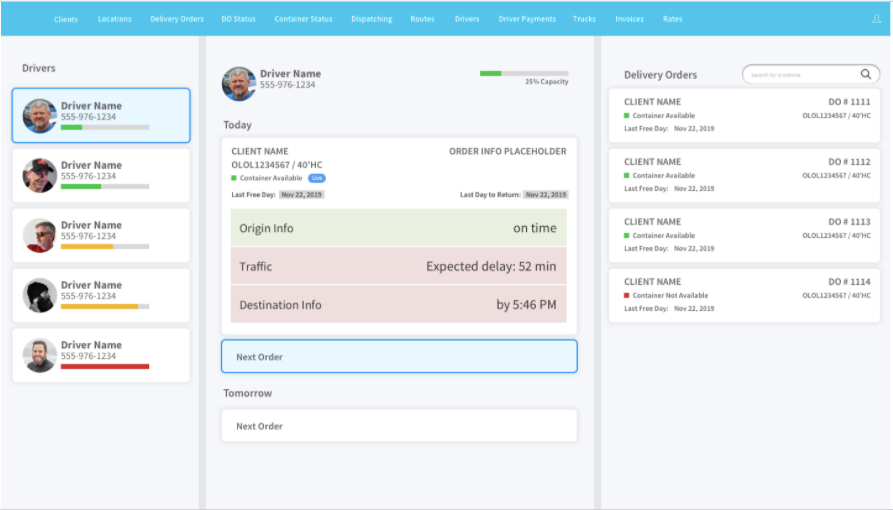
The next exploration of the design looked to leverage components from existing react.js libraries.

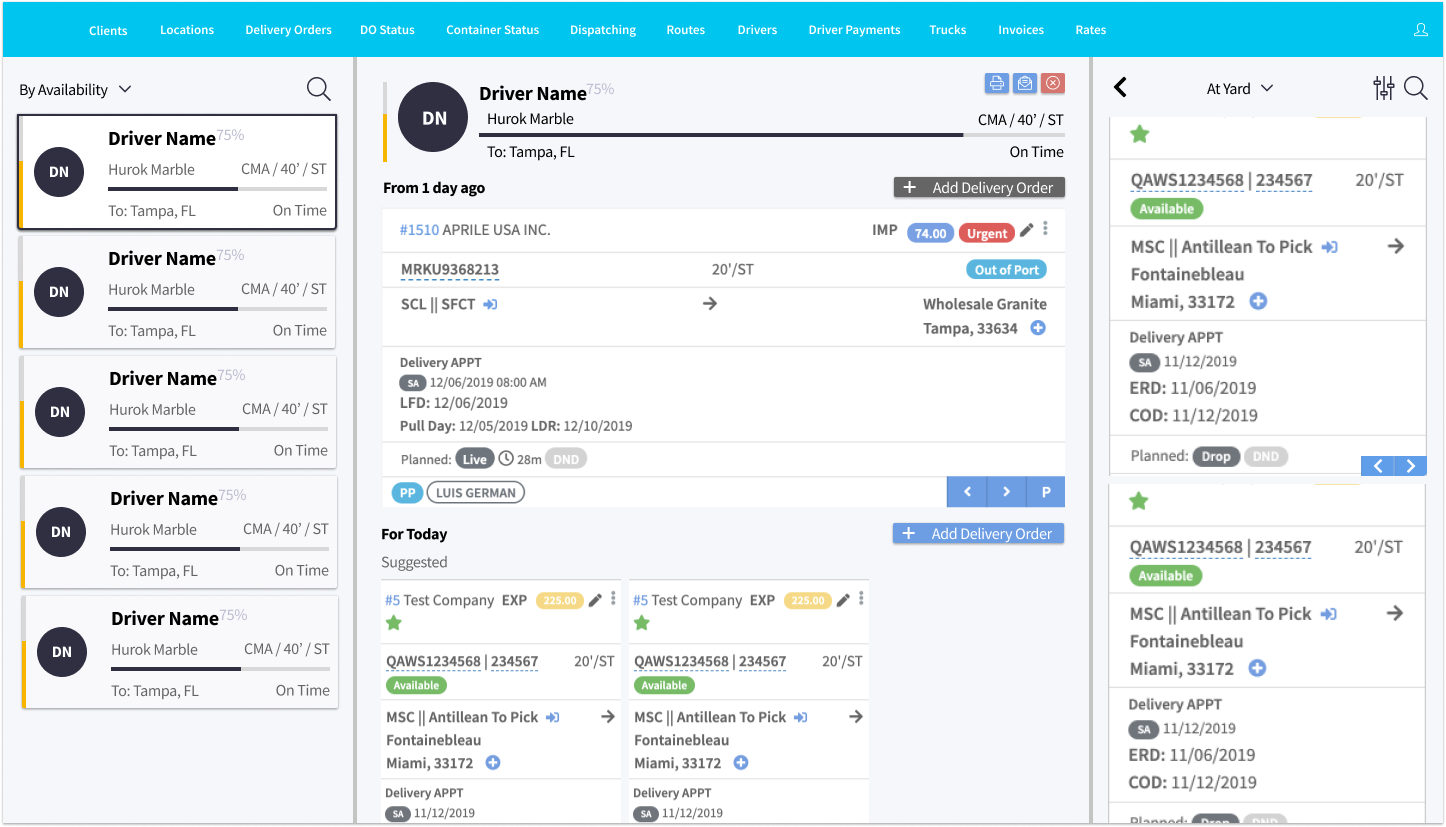
The client loved the design, and the first hand off began, the client wanted to implement quickly in their existing application.
The implemented result was the following:
Now that we had a version we could test "in the wild" with users, I went back to the location where the users where, and did some usability testing.
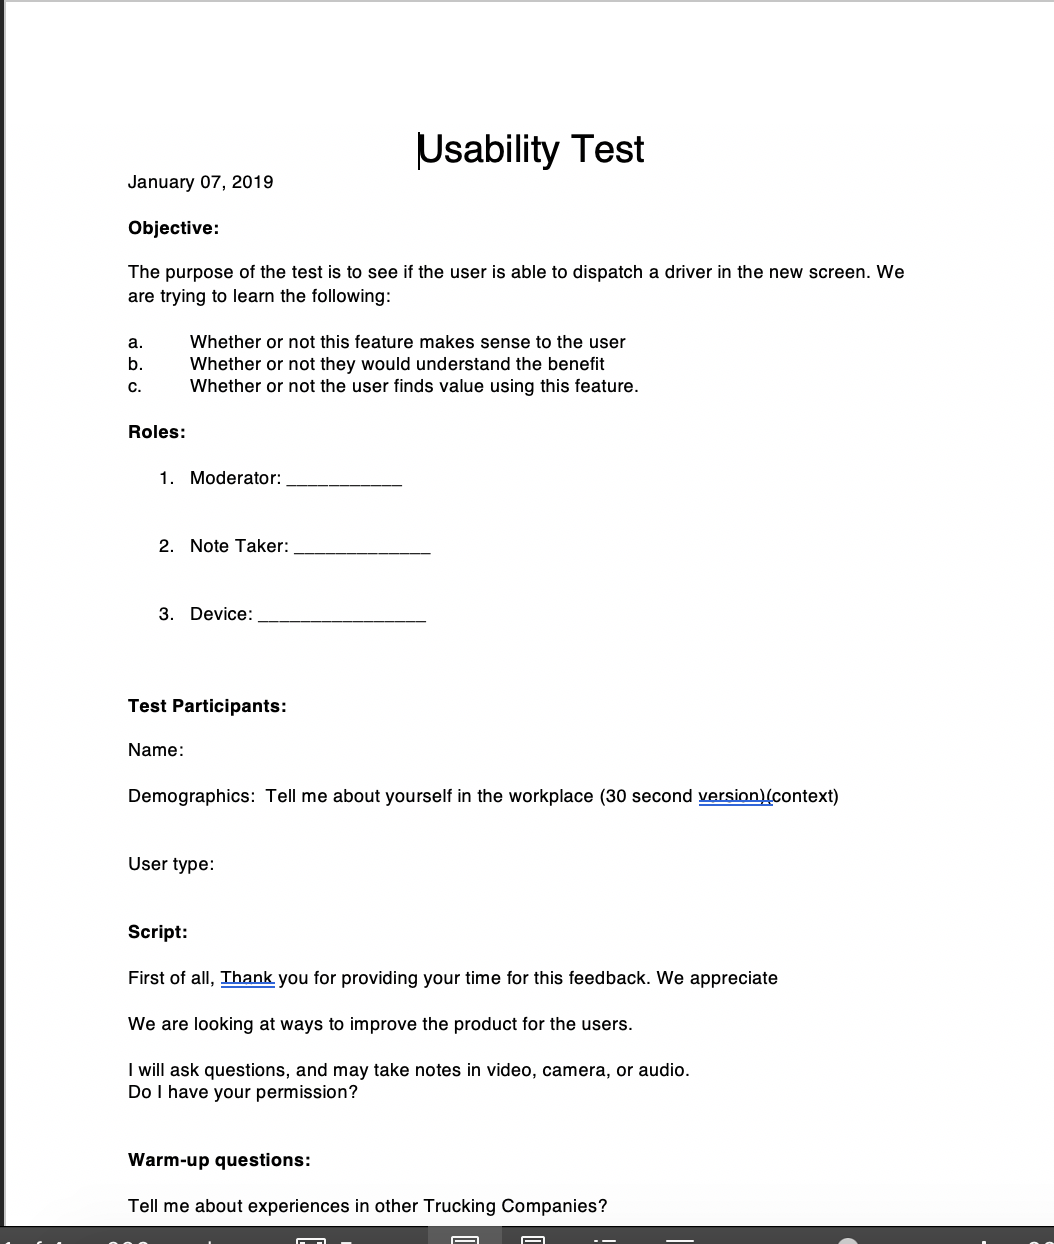
This is a copy of the report I sent using invision.
The visual design explorations, began to get better, in order to compete in the market. The visual direction of the redesigned app then became the following. Making the app feel modern, lighter and mobile friendly.
.png)
.png)
Aligning the new interface with the new graphQL layer, required some more endpoint mapping.
The client started this project as an exploration in design, because of the team's hard work, the client extended the scope of work to development in React of the designs, more screens to UX and the creation and development of a graphQL layer.
This was only one slice of the redesign effort, as there were different parts of the product that needed attention.